Understanding How Your Program is Using Memory
MemoryScape can help you understand how your program is using memory in these ways:
• Its Memory Usage reports show how much memory your program’s processes are using. (See Task 5: Seeing Memory Usage.)
• Its compare feature displays the differences between your program’s current memory state and saved memory data or the differences between two sets of saved memory data. (See Task 13: Comparing Memory.)
• Its heap status reports tell you how much memory your program allocated and where it was allocated. (See Task 8: Obtaining Detailed Heap Information.)
You can examine imported memory state information in the same way as the memory for a live process. For example, you can look for leaks, graphically display the heap, and so on.
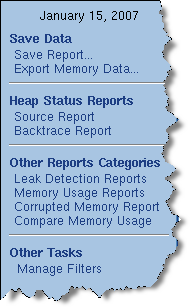
Use the Export Memory Data command on the left side of many screens when you want to save memory data, Figure 17.
Figure 17: Memory Reports Commands |
 |
At a later time, you can import this data back into MemoryScape using the Add memory debugging file command, which is on the Home | Add Program screen.
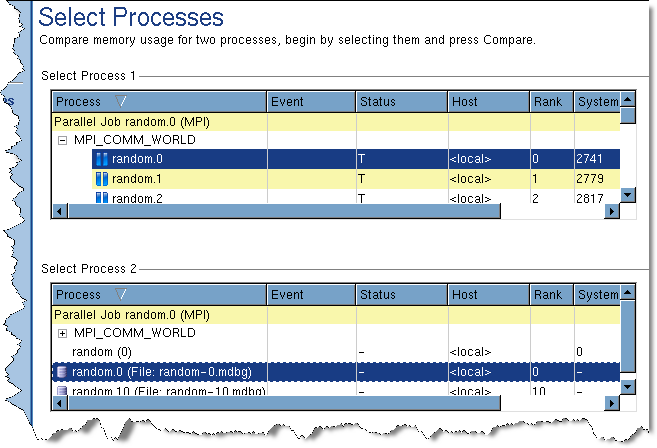
MemoryScape treats this imported information in nearly the same way as the information it has accumulated for a live process. After selecting Memory Reports | Memory Comparisons, MemoryScape displays a screen containing all processes and imported files,Figure 18.
)
Figure 18: Select Processes and Files |
 |
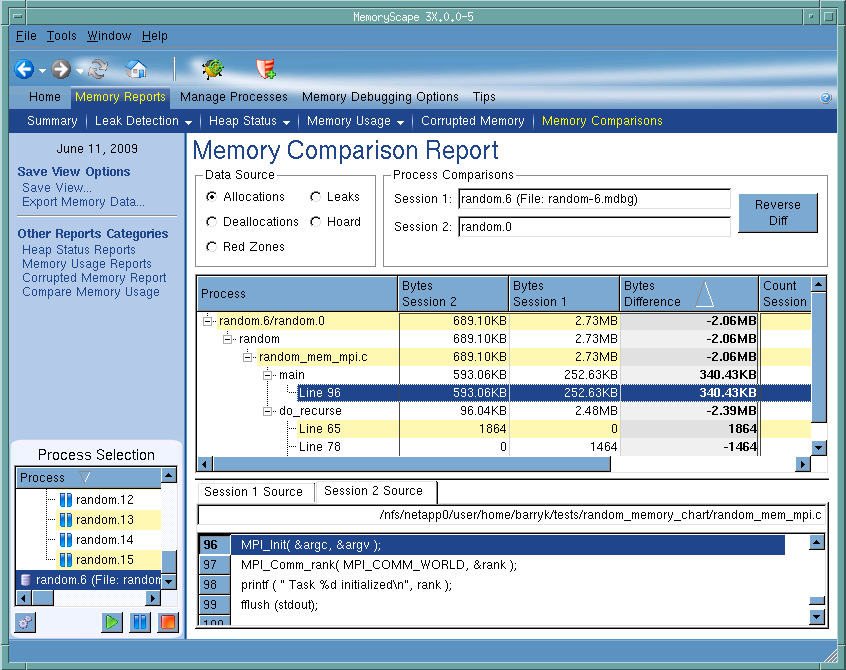
After you select two processes, MemoryScape can display the differences between this information, Figure 19.
Figure 19: Memory Comparison Report |
 |


