Process and Library Reports
The Process report (the bottom snapshot in Figure 53) lists all your processes and information about them. To sort, click on a column header.
Figure 53: Memory Usage Library and Process Reports 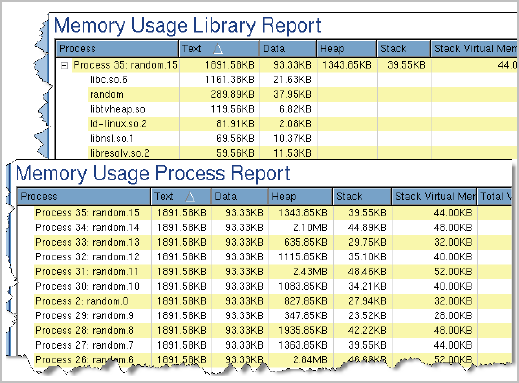 |
In a similar manner, a Detailed program and library report of your memory usage shows this information for your program and all libraries it uses.
Not shown in this figure are the process controls on the left. By selecting (or unselecting) processes and threads, you can control which are shown in these tables.
It can be difficult to know what to do if you identify a problem here. The only component over which you have direct control is the one you’ve written. Fortunately, this is usually where the problem is. If, however, the problem is with a library that your program loaded, you do have options. If you have control over the library, you can investigate that library’s behavior. For example, MemoryScape does identify leaks within libraries.
If the problem is one you can’t control, your choices are limited. You could attempt to obtain a different version of the library. Or, if you can identify the cause of the problem, write a substitute function.
If, however, the problem is in your code, MemoryScape offers many ways to drill down and obtain information.


