Examining Memory
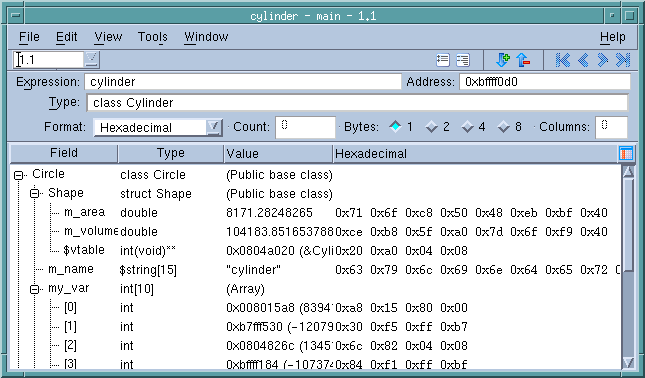
TotalView lets you display the memory used by a variable in different ways. If you select the View > Examine Format > Structured or View > Examine Format > Raw commands from within the Variable Window, TotalView displays raw memory contents. Figure 129 shows a structured view.
 |
NOTE: The way this command displays data is similar to the way dump commands such as od that exist in your operating system display data.
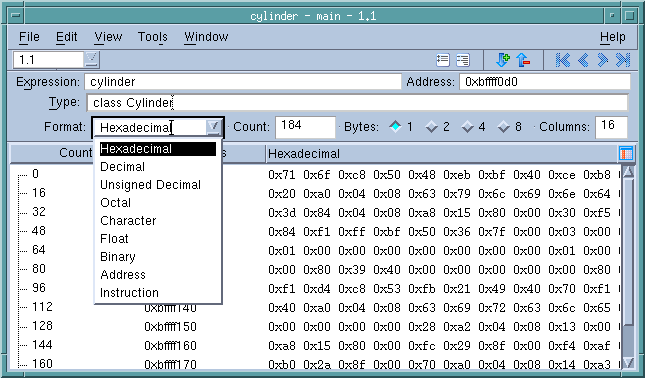
When displaying a structured view, the left portion of the Variable Window shows the elements of the data, whether it be a structure or an array. The right portion shows the value of the data in the way that it is normally displayed within TotalView. The right-most column displays the raw memory data. By default, this information is displayed in hexadecimal. However, you can change it to other formats by selecting a representation within the Format pulldown. Figure 130 shows a raw display with this pulldown extended:
 |
In either the raw or structured display, you can change the number of bytes grouped together and the range of memory being displayed.
If you select the View > Block Status command, TotalView will also give you additional information about memory. For example, you are told if the memory is in a text, data, or bss section. (If you see unknown, you are probably seeing a stack variable.)
In addition, if you right-click on the header area of the table, a context menu lets you add a Status column. This column contains information such as “Allocated”, “PostGuard”, “Corrupted PreGuard”, etc.
If you have enabled the Memory Debugger, this additional information includes whether memory is allocated or deallocated, or being used by a guard block, or hoarded.


