Finding free() and realloc() Problems
MemoryScape detects problems that occur when you allocate, reallocate, and free heap memory.
This memory is usually allocated by the malloc(), calloc(), and realloc() functions, and deallocated by the free() and realloc() functions. In C++, MemoryScape tracks the new and delete operators. If your Fortran programs and libraries use the heap API, MemoryScape tracks their dynamic memory use. Some Fortran systems use the heap API for assumed-shape, automatic, and allocatable arrays. See your system’s man pages and other documentation for more information.
Event and Error Notification
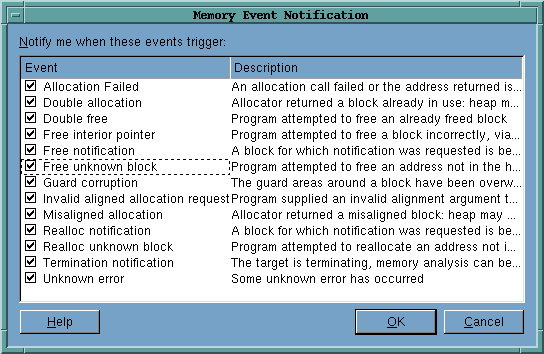
There are a number of events that can cause MemoryScape to stop your program’s execution, and you can control which of these will actually halt execution by selecting the Advanced button in the Halt execution area of the Memory Debugging Options screen, Figure 20.
Figure 20: Memory Error Notification Dialog Box |
 |
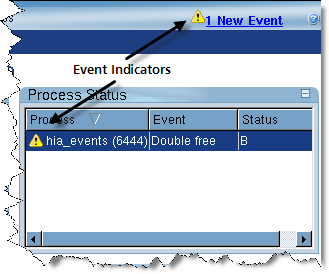
When one of these errors occurs, MemoryScape places event indicators by the process and at the top of the window, Figure 21.
Figure 21: Event Indicators |
 |
When you click on one of these indicators, MemoryScape displays the Manage Processes | Process Events screen, Figure 22.
Figure 22: Process Event Screen |
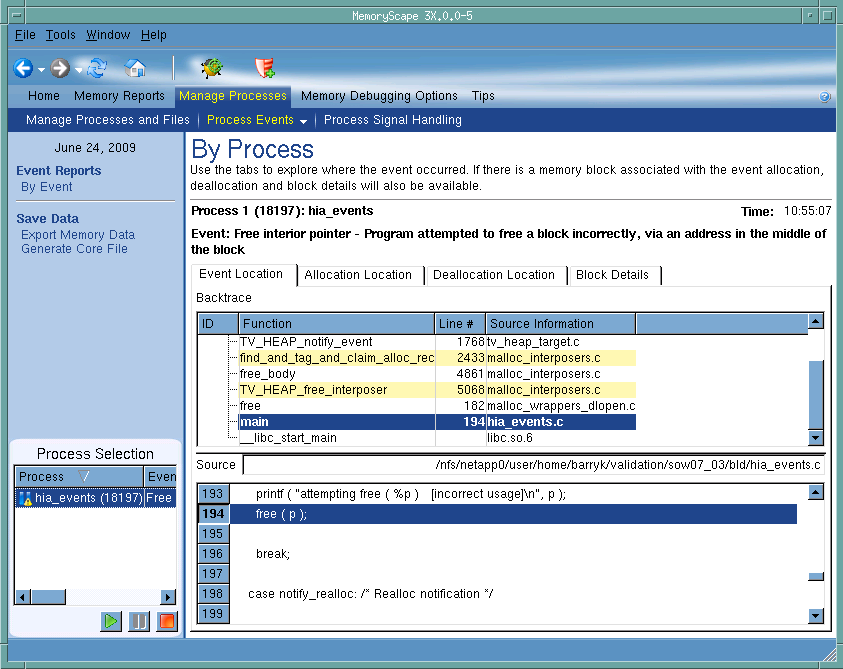 |
This screen contains the following kinds of information:
• The bold information reports the type of error or event that occurred.
• The Event Location tab contains the function backtrace if the error or event is related to a block allocated on the heap. This is the backtrace that exists when the event occurred. Depending upon the problem, you may also want to examine the information in the next two tabs.
• The Block Details tab displays this information in a manner similar to that shown in a graphical heap display.
• MemoryScape retains information about the backtrace that existed when your program allocated and deallocated the memory block. Select which to display using either the Allocation Location or Deallocation Location tab.
If a memory error occurred, the deallocation backtrace is often the same as the backtrace shown in the Event Location tab. If the memory error occurs after your program deallocated this memory, the backtraces are different.


