Displaying Graph Views
The File > Options Dialog Box controls graph display. (A different dialog box appears if the Visualizer is displaying a surface view.)
 |
Options:
Lines
Displays lines connecting dataset elements.
Points
Displays points (markers) for dataset elements.
Transpose
Inverts which axis is held constant when generating a graph of a two-dimensional object. For other than two dimensions, this option is not available.
Figure 180 shows a sine wave displayed in three different ways:
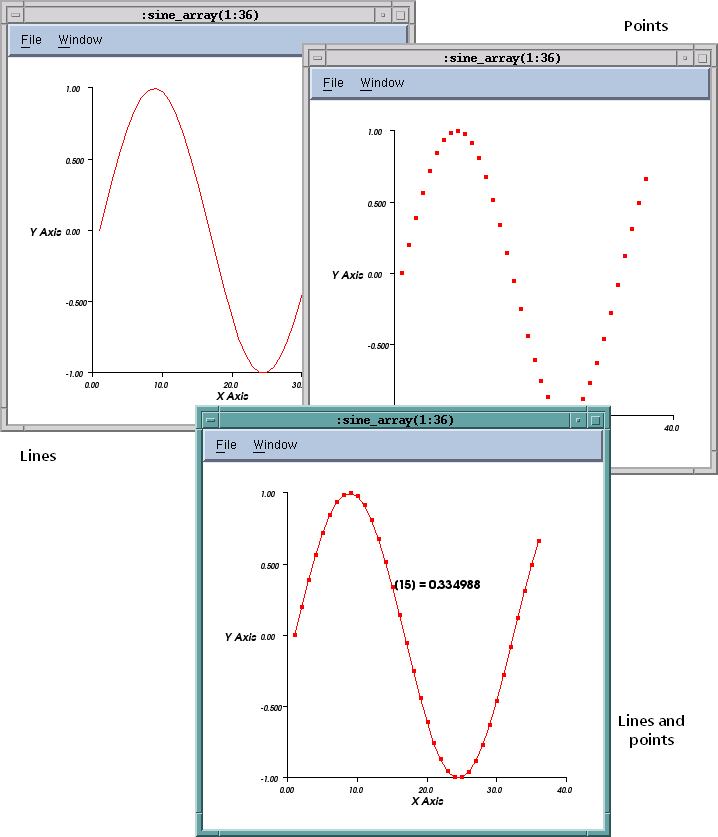 |
To see the value of a dataset’s element, place your cursor near a graph marker, and type “P”. The bottom graph in Figure 180 shows the value of a data point.


