The Memory Event Report View
Memory events are logged in the Event Report view. To stop your program for memory errors and generate an event report, enable memory debugging (Debug > Enable Memory Debugging), then choose Debug > Stop on Memory Events. 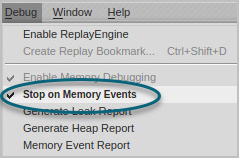
When a memory error occurs, TotalView stops your program and launches the Event Report view to display the error(s).
If you close the view during a debugging session, reopen it by choosing Debug > Memory Event Report.
The Event Report view reports the error (in this example, a double free allocation error) and its block address. The view’s Backtrace pane provides detail on the location of the error, as well as where it was allocated or deallocated, Figure 161.
Figure 161, The Memory Event view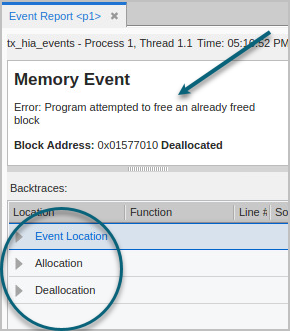
To locate the error, open the Event Location dropdown, which highlights the location of the error. Selecting the error in the dropdown displays the location of the error in the Source view.
Figure 162, Memory Event Report, Event Location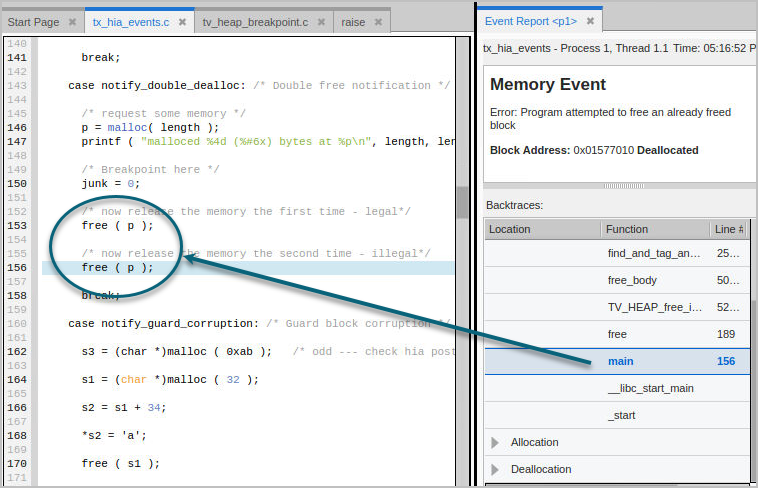
Additional information is available via the Allocation and Deallocation dropdowns in the Backtrace, Figure 163.
Figure 163, Memory Event Report, backtrace pane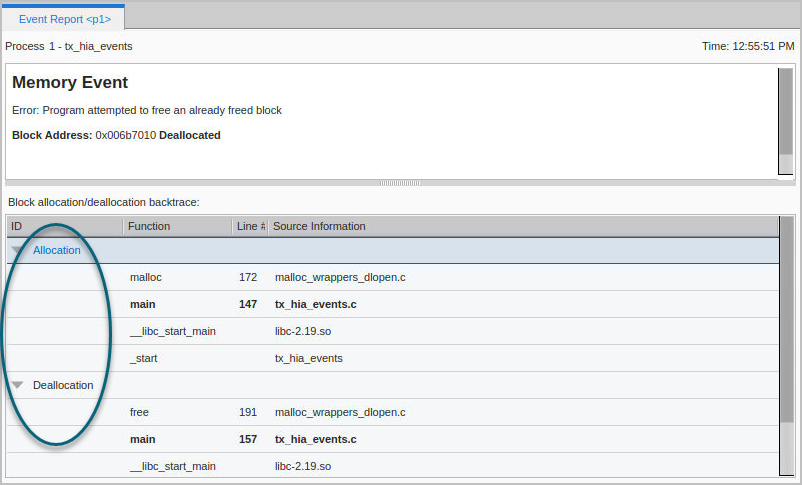
These dropdowns identify the lines at which any memory was allocated and deallocated in the program. Selecting a line in the backtrace displays that line in the Source view.


