Action Points, CLI, and Logger Views
The lower display area features a number of views.
Action Points View. This view lists all of the action points — breakpoints, evalpoints, and barrierpoints — in your debugging session. You can add, delete, enable, and disable actions points in this view.
Command Line View. Although not yet fully supported in the UI, the full power of the Classic TotalView debugging engine is available through the Command Line Interface (CLI). You can enter those commands in this view.
Logger. This view makes it easy to see the log messages that TotalView issues.
Note that the Command Line and Logger views allow text selection, cutting, and pasting of their contents.
Figure 10, Action Point, Command Line, and Logger Views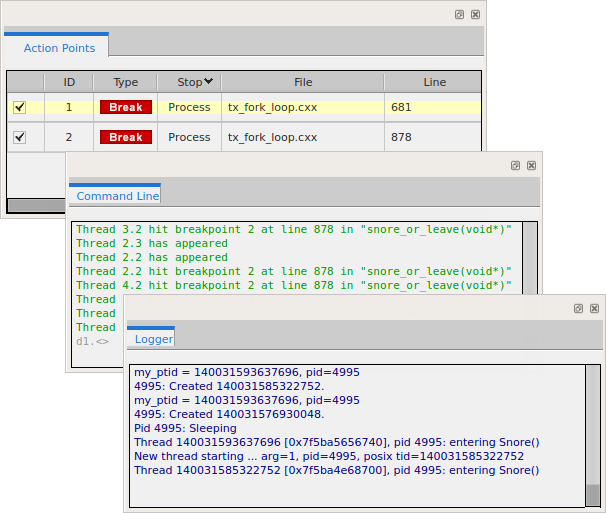
Detailed information about the Action Points view | |
More information about the Command Line view |


