A Tour of the Interface
Here we introduce the main views that make up the interface. If a view is not visible, restore it through the Preferences dialog, the Window | Views menu, or the context menu available by right-clicking in the toolbar area.
Central Area
When you first start up TotalView, the central area contains either just the Start Page, or the Start Page and a Source view if you started TotalView with an executable name argument. This area is reserved for displaying the Start Page, Source views of code, the Help view, and other debug status and data specific views associated with your debugging session.
Central area views cannot be re-docked into the side or bottom secondary view areas, but they can be re-docked within the central area to create their own optimal debugging layout, such as a side-by-side layout.
Figure 3, Source View and Start Page in the central area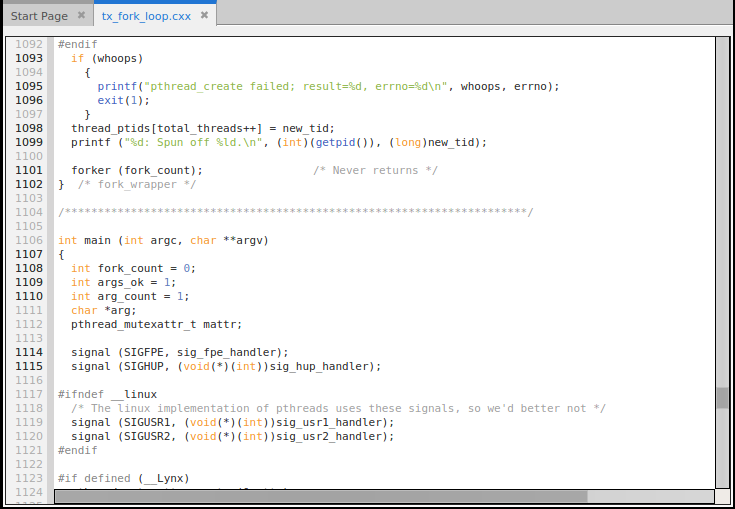
The Source View
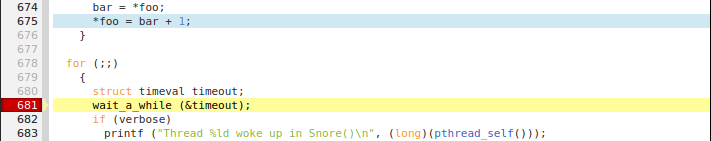
Viewing the Program Counter
Source view actions
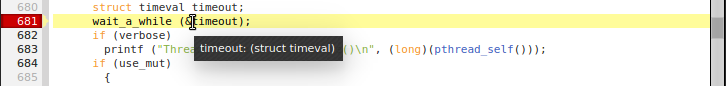
If you highlight the function name and select “Navigate to File or Function” from the context menu, TotalView finds and displays the source for the function, if the source is available. If there is more than one source location, displays the function name as a search in the Lookup view.
Unified Source View Display
The Source view provides a unified view of source-line breakpoints across all image files containing the source file, useful for programs in which the same source file or header file is compiled into multiple image files (e.g., executable and shared library files) used by the process.
Line numbers appear bold where TotalView has identified executable code, i.e., source code lines where the compiler has generated one or more line number symbols in the debug information.
For example, consider debugging a program that launches CUDA code running on a Graphics Processing Unit (GPU). When the host program is first loaded into TotalView, the CUDA threads have not yet launched, so the debugger has no symbol table information yet. Figure 4 shows the Source view before and after a CUDA kernel launch. Before the CUDA threads exist (the left pane), only line 134 has been identified as having executable code.
Figure 4, Unified Source view display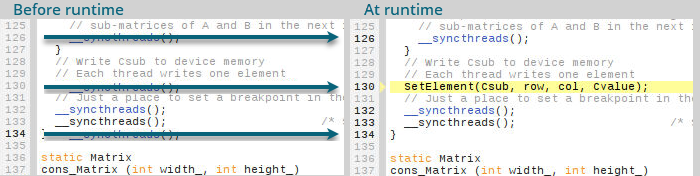
Once the program is running and the CUDA threads have started (the right pane), lines 126, 130, 132, 133, and 134 are bold, so now TotalView has been able to identify line number symbols at those locations.
Using the Source view to set action points (breakpoints) | |
Source views and their relationship to data display |


