The Process Window
When you load any program or process into TotalView, the Process Window launches, displaying state about the current program or process and its threads. It includes some of the typical menu items of any GUI application (such as File, Edit, and View) and provides access to most of TotalView’s features.
It is here that you set breakpoints, step through your program, and manage its threads.
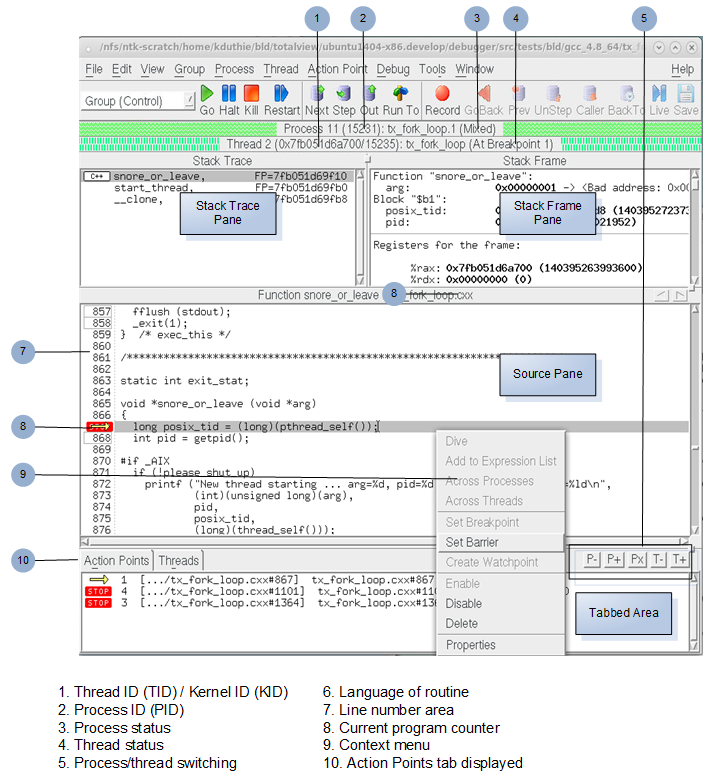
The Process Window is divided into four areas:
 Stack Trace Pane
, displaying the call stack.
Stack Frame Pane, displaying the current thread’s variables.
Source Pane, displaying your program’s source code or assembly instructions. Note the context menu that becomes available when you select a line of code in your program.
In the “tabbed area”:
Action Points Tab, which displays a list of the thread’s current action points (TotalView nomenclature for its powerful set of breakpoints).
Processes/Ranks Tab, displaying a grid of the processes or ranks within the current control group.
Threads Tab, with a list of all active threads in the process.