The Processes and Threads View in Relation to Other Views
The Processes and Threads view displays the state of the processes under debugger control at any given moment. The view updates each time one or more processes moves to some other part of the code. If you have set breakpoints, often some number of threads will be stopped at one, but even if all threads are running, this state will be shown in the view.
Figure 78, Relationships of Processes and Threads, Source, Call Stack, and Data Views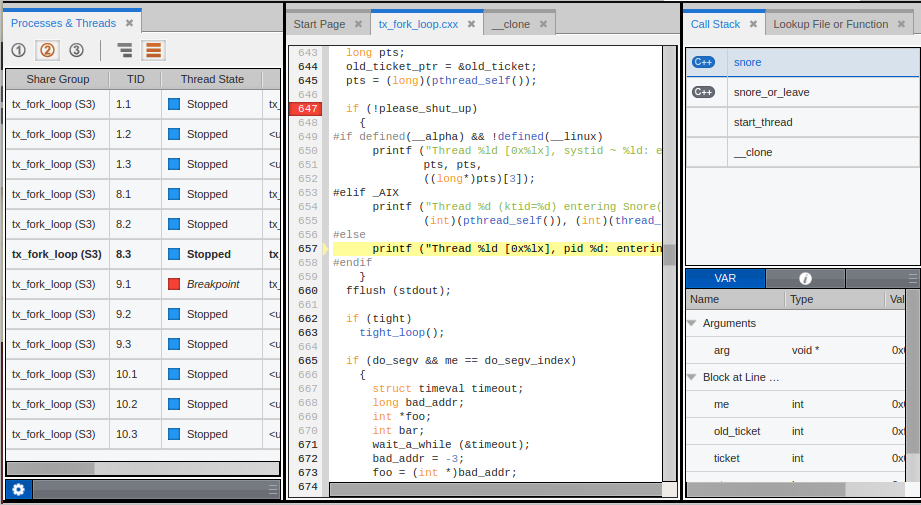
If you are displaying the Thread IDs, one of the lines is highlighted in bold (Thread ID 8.3 above). That line determines the display in the Source view, as well as the Call Stack, Local Variable (VAR), and Data views.
If you are not displaying individual thread IDs, the line representing the aggregate that contains the current thread of focus is bold. If you double-click on another line, the display changes to represent the source location, call stack, and data values pertinent to that line.


