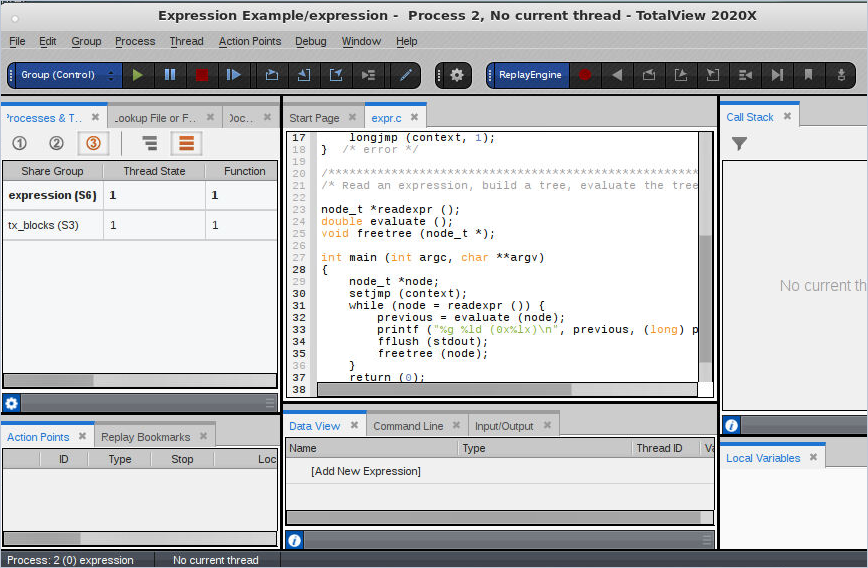
Initial Display
At startup, TotalView displays your program’s code in the central area’s Source pane, along with its default views: the Processes & Threads, Lookup File or Function, Action Points, Call Stack, Local Variables, Documents, and Data View.

The
Processes & Threads view lists all processes and threads under TotalView control. You can use the
Window > Views menu item to customize the displayed views.
Since the program has been created but not yet executed, there is no process or thread listed here.
The
Lookup File or Function view takes any keyword search and returns a file or function from within your program’s files.
The
Documents view displays all open files in the order in which their tabs appear in the central area.
The
Replay Bookmarks view displays bookmarks created to mark a point in program execution history.
Action Points displays any breakpoints you set.
The
Call Stack view shows the backtrace of the thread that is currently in focus once the program is running.
The
Local Variables view displays information on the current thread’s variables.
The
Source view in the central area displays your source code’s
main() function before execution.
Several views are also visible at the bottom: Data View, Command Line, and Logger.
Data View enables you to evaluate expressions to observe your data while your program is running.
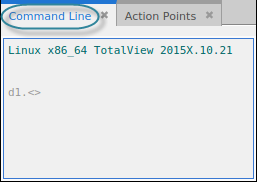
Command Line, which, when selected, displays a prompt for entering CLI commands:
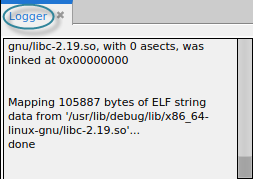
Logger which, when selected, displays logging output from TotalView:
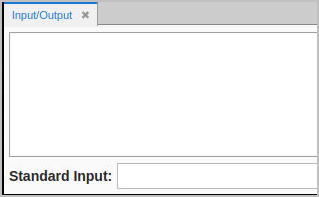
Optional: The
Input/Output view displays
stdout and
stderr, and supports entering input directly into the user interface rather than only through the terminal. This view is turned off by default. To display it, select
Window > Views > Input/Output.