The Source Pane
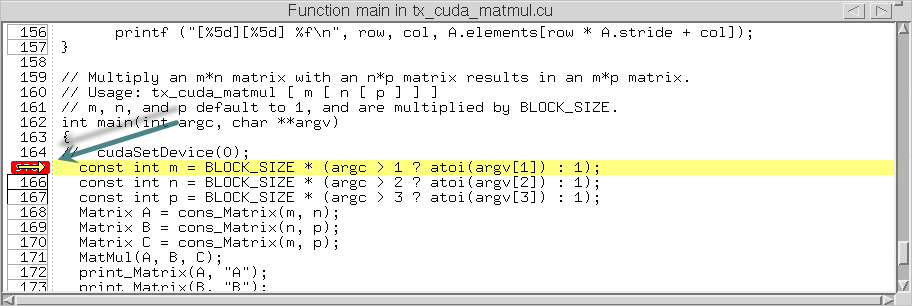
The Source Pane located in the center of the Process Window displays the source code for source or header files that are compiled into the image files (e.g., executable or shared libraries) loaded into the process. The arrow in the left margin of the Source Pane indicates the location of the PC for that stack frame.
 |
Unified Source Pane Display
The Source Pane provides a unified view of source-line breakpoint boxes across all image files containing the source file, useful for programs in which the same source file or header file is compiled into multiple image files (e.g., executable and shared library files) used by the process.
To see how this works, remember that breakpoint boxes appear on lines where TotalView has identified executable code, i.e., source code lines where the compiler has generated one or more line number symbols in the debug information. A gray box denotes that there is exactly one line number symbol for that source line, while a black box denotes multiple line number symbols for that line.
For example, consider debugging a program that launches CUDA code running on a Graphics Processing Unit (GPU). When the host program is first loaded into TotalView, the CUDA threads have not yet launched, so the debugger has no symbol table information yet.
Figure 70 shows the Source Pane before and after a CUDA kernel launch. Before the CUDA threads exist (the left pane), lines 126, 130, 132, and 133 have no boxed lines, meaning that TotalView can find no line number symbols associated with those lines. Additionally, line 134 has a gray line, meaning that TotalView has identified one line number symbol associated with the host (CPU code).
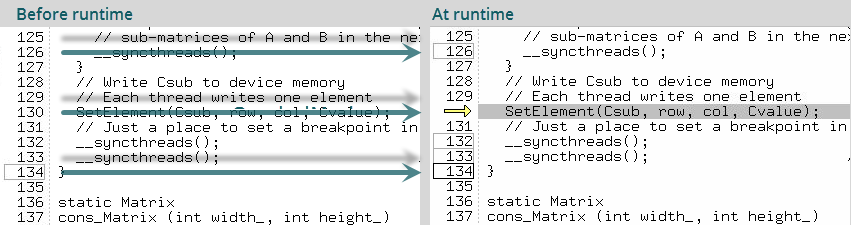 |
Once the program is running and the CUDA threads have started (the right pane), lines 126, 132, and 133 have gray lines, so now TotalView has been able to identify line number symbols at those locations. This is also true of line 130 which is obscured in the right pane by the PC icon. Further, line 134 has turned from gray to black, denoting that TotalView has found additional line number symbols, in this case one from the host (CPU) code and one from the CUDA (GPU) code.
Setting breakpoints in CUDA code | |
Dynamically loading shared libraries using the ddlopen command | ddlopen in the TotalView Reference Guide |
More on setting breakpoints |


