The TotalView CUDA Debugging Model
The address space of the Linux CPU process and the address spaces of the CUDA threads are placed into the same share group. Breakpoints are created and evaluated within the share group, and apply to all of the image files (executable, shared libraries, and CUDA ELF images) in the share group.
That means that a breakpoint can apply to both the CPU and GPU code. This allows setting breakpoints on source lines in the host code that are then planted in the CUDA images at the same location once the CUDA kernel starts.
Consider a Linux process consisting of two Linux pthreads and two CUDA threads. (A CUDA thread is a CUDA context loaded onto a GPU device.) Figure 265 illustrates how TotalView would group the Linux and CUDA threads.
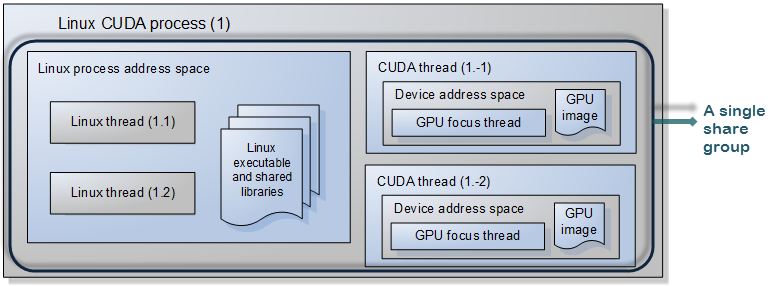 |
The Linux host CUDA process
A Linux host CUDA process consists of:
The above TotalView CUDA debugging model is reflected in the TotalView user interface and command line interface. In addition, CUDA-specific CLI commands allow you to inspect CUDA threads, change the focus, and display their status. See the dcuda entry in the Classic TotalView Reference Guide for more information.


