Task 2: Adding Parallel Programs
Everything discussed in Task 1: Getting Started also applies to parallel programs, but additional information is required before you can collect memory information on programs running in parallel.
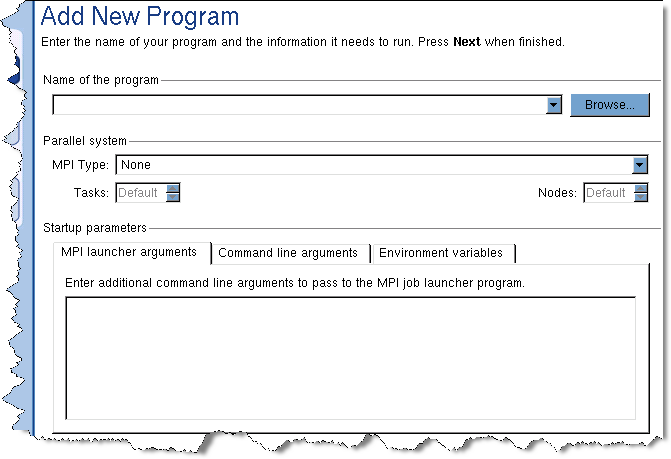
First, select Home | Add Program. (This is also the screen displayed if you do not name a program when starting MemoryScape.) Next, select Add parallel program to launch the Add New Program dialog, Figure 37.
Figure 37: Add New Program (Parallel) Screen |
 |
The information entered here could also be entered directly on a command line, with no difference in the way your program behaves. For detailed information, see Setting Up MPI Debugging Sessions.
The information that is unique to parallel programs is as follows:
MPI Type
Select one of the MPI systems in this list.
Tasks
Enter the number of processes that your program should create. This is equivalent to the -np argument used by most MPI systems.
Nodes
Some MPI systems let you specify the number of nodes upon which your tasks will execute. For example, suppose your program will use 16 tasks. If you specify four nodes, four tasks would execute on each node.
MPI launcher arguments
If you need to send command-line information to your MPI system, enter them in this area.
After selecting memory debugging options (the next task) and starting execution, MemoryScape begins capturing information from each executing task. The sole difference between using MemoryScape on a parallel program versus a non-parallel program is that you have many processes to examine instead of just one. Figure 38 shows the Process Status and Control area for a 32-process MPI job.
Figure 38: Process Status and Control Area |
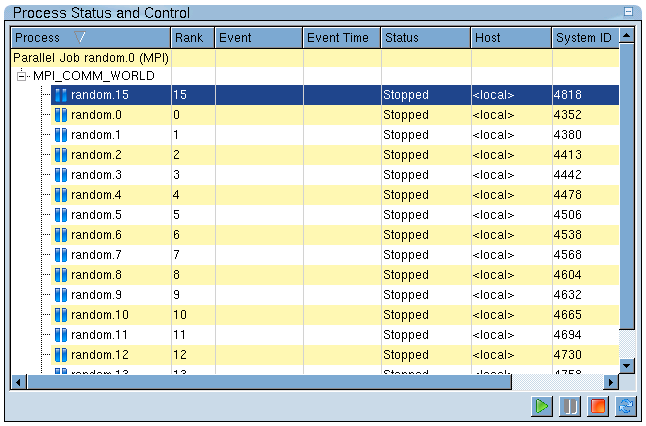 |
MemoryScape will be collecting data on each of the 32 processes, allowing you to examine memory information for each. Examining each, however, is seldom productive. Instead, you need to focus in on where problems may occur. The Memory Usage charts are often the best place to start. Figure 39 shows part of a stacked bar chart.
Figure 39: Process Status and Control Area, Stacked Bar Chart |
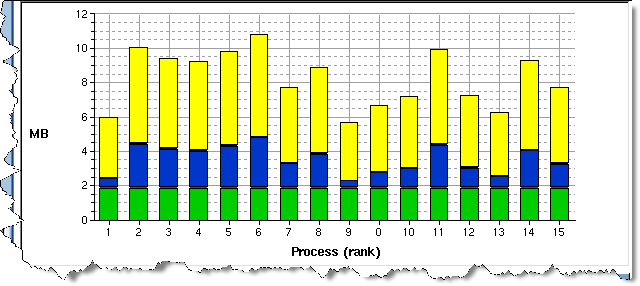 |
Given this graph, you probably want to start with a look at process 6, as it is using the most memory. You might also want to use memory comparison features to compare process 6 to process 9, the process using the least memory.
If possible, run your program a few times, stopping it periodically to get an idea of how it uses memory so you can identify any patterns. Another time, you may want to stop the program periodically when you see memory use changing and then export memory data. In this way, you can perform detailed analyses later. This is particularly important in situations where access to HPC machines is limited.
NOTE >> For remote processes, the only way to reliably configure MemoryScape is to set the TVHEAP_ARGS variable. For information, see TVHEAP_ARGS. |


