Finding Memory Leaks
MemoryScape can locate your program’s memory leaks and display information about them. Here’s what you can do:
1. Run the program and then halt it when you want to look at memory problems. You should allow your program to run for a while before stopping execution to give it enough time to create leaks.
3. Select a report. For example, you might select Source Report.
The top portion shows all of your program’s files. The second column in this list shows the number of bytes that are leaked from code in those files. You may want to click on the Bytes header so that MemoryScape displays which files have the greatest number of leaks.
Figure 23: Leak Detection Source Report |
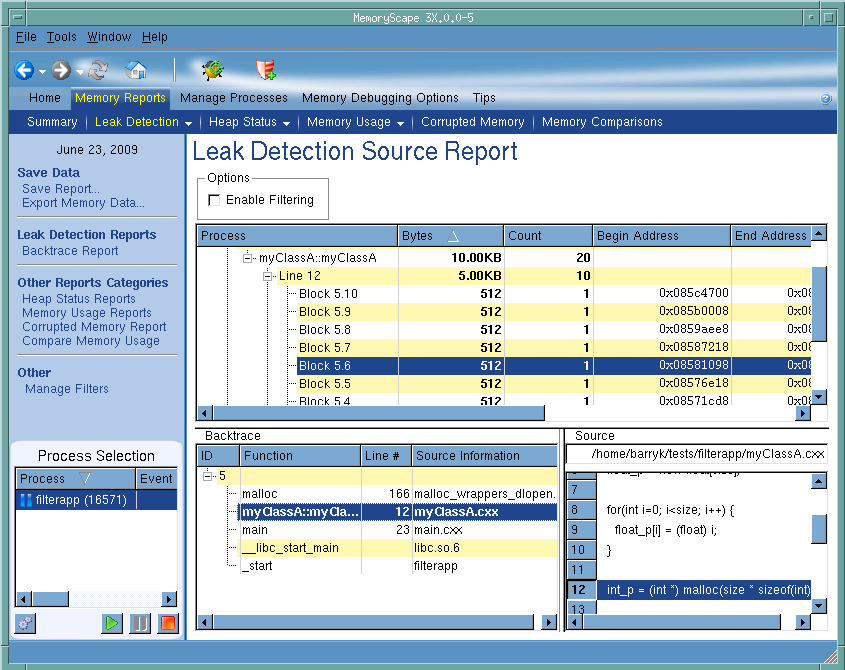 |
4. After you select a leak in the top part of the window, the bottom of the window shows a backtrace of the place where your program allocated the memory. After you select a stack frame in the Backtrace pane, MemoryScape displays the statement where the block was created.
The backtrace that MemoryScape displays is the backtrace that existed when your program made the heap allocation request. It is not the current backtrace.
Many users like to generate a report that contains all leaks for the entire program. If you are running with TotalView, you can set a breakpoint on your program’s Exit statement. Otherwise, MemoryScape will automatically stop your program during your program’s exit. After your program stops executing, generate a Leak Detection Report. You may want to write this report to disk.
MemoryScape uses a conservative approach to finding memory leaks, searching roots from the stack, registers, and data sections of the process for references into the heap. Although leaks will not be falsely reported, some leaks may be missed. If you are within a method that has leaks, you may need to step out of the method for the leak to be reported. Leak detection may be sensitive to the compiler used to build the program.


