Chart Report
While the information tables in the Process and Library reports are useful, the best place to start is the Chart report, which offers a graphic look at your program’s memory data, Figure 54.
Figure 54: Memory Usage 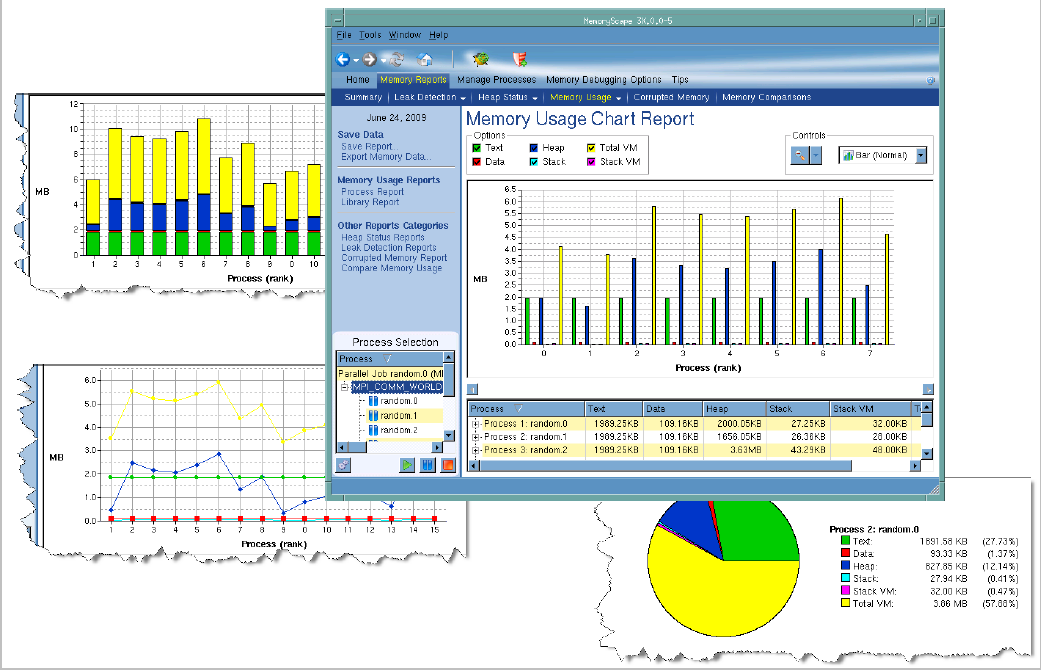 |
MemoryScape can display your information using a range of charts: Bar, Stack Bar, Line, and Pie, available from the pulldown list in the Controls area. In addition, you can zoom in or out to control the view.
The Options area at the top controls which of the six types of memory information are displayed.
The process area below the charts control which processes and threads to chart.


