Basic Options
MemoryScape automatically displays the Memory Debugging Options screen after you add a program. You can also display it by selecting Memory Debugging Options on the primary navigation bar, Figure 40.
Figure 40: Memory Debugging Options |
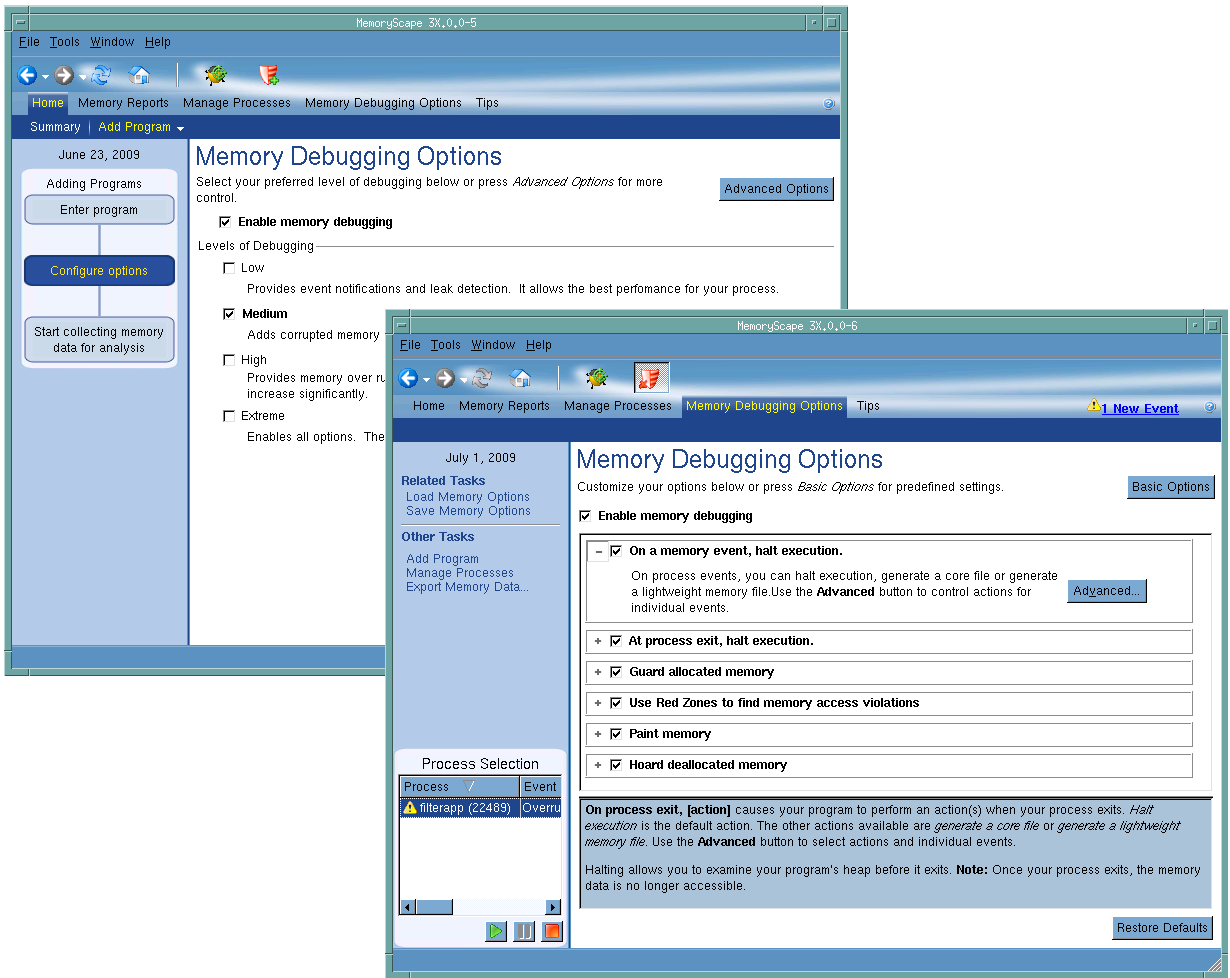 |
These options control the level of debugging activity: Low, Medium, High, or Extreme.
Low
Records all memory requests, including calls to malloc(), realloc(), and other calls to your malloc library. It also includes calls to C++ operators such as new and delete that indirectly use this library. It can even include memory management functions performed by some Fortran libraries.
When you ask for a report, MemoryScape analyzes this recorded information and displays the information you request.
This selection also sets automatic event notification.
In most cases, Low is all you’ll ever need.
Medium
In addition to performing all operations indicated by Low, MemoryScape writes guard blocks before and after allocated memory blocks. For more information on guard blocks and locating corrupted memory, see Task 11: Viewing Corrupted Memory.
This setting increases the size of the allocated memory block, but the extra overhead is small.
Select Medium only when you need to check for corrupted memory.
High
In addition to performing all operations indicated by the Low level, MemoryScape writes a Red Zone after the allocated memory block and notifies you if you access memory in this Red Zone. This is called an overrun.
In this case, the additional allocated memory can result in significant extra overhead.
Select High only if you need to check for memory overruns. As an alternative, select Low and use the Red Zones button on the task bar to turn on Red Zones as needed for suspect allocations.
To find underruns in your allocated memory, see Use Red Zones to find memory access violations.
Extreme
In addition to performing all operations indicated by the Low, Medium, and High levels, MemoryScape paints allocated and deallocated memory as well as hoard memory.
These activities both decrease performance and use more memory. For information on when to use these features, see Task 15: Hoarding Deallocated Memory and Task 16: Painting Memory.
Select Extreme only if you need hoarding and painting.
NOTE >> Red Zone controls appear on the toolbar only on platforms that support Red Zone capabilities. See the Platform Guide for specific platform support. This applies to the High and Extreme levels only. |
For a combination of options unavailable on this screen, see Advanced Options, which allow you to select options a la carte, as well as change default settings.


