Tools > Parallel Backtrace View
The Parallel Backtrace View displays in a single window the state of every process and thread in a parallel job. This view displays the host, status, process ID, rank, and location, enabling you to view thousands of processes from a single window. Instead of clicking through multiple windows to determine where each process has stopped, use the Parallel Backtrace View for a quick overview to help you identify stray processes.
You can access the Parallel Backtrace View from the Tools menu.
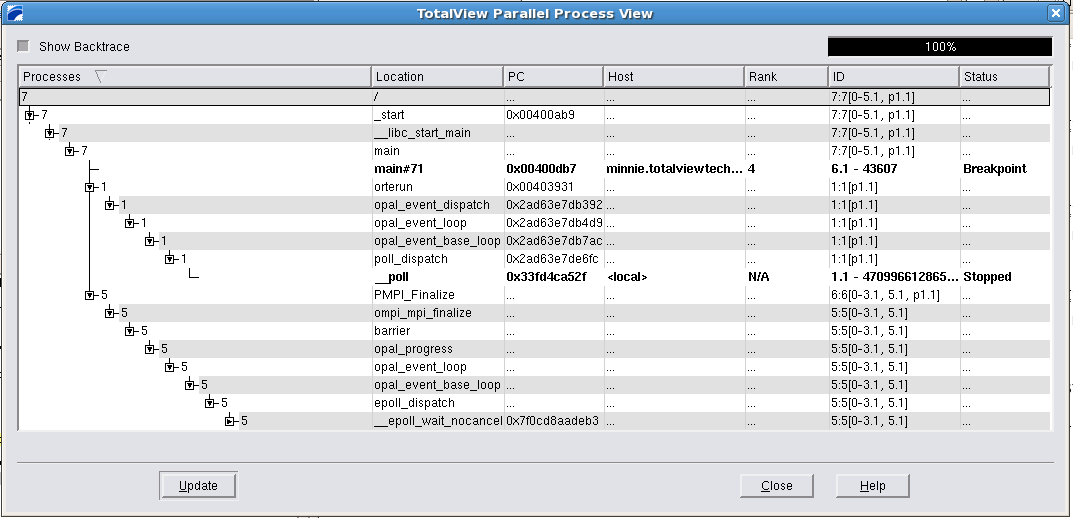 |
The Parallel Backtrace View allows you to see the position of all processes/threads at the same time. A program is displayed as a branching tree with the number and location of each process/thread at each point. The View shows:
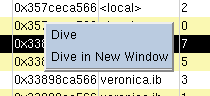
You can dive on each of the expanded items and display its process window by using the right mouse button.
 |
The progress indicator in the upper right corner of the Parallel Backtrace View provides information regarding the progress of collecting and displaying information.
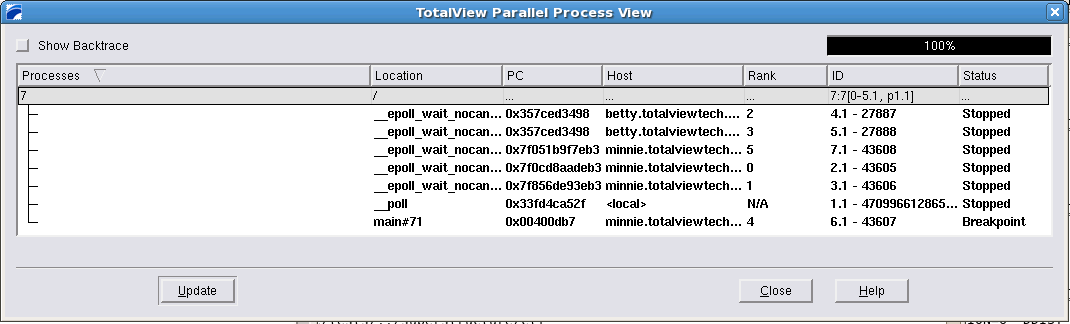 |
Use the Show Backtrace toggle in the upper left corner to hide the intervening branches and display the start routine and current execution location of the processes/threads. This removes some of the clutter in the display, as shown in Figure 78.
If a thread/process state changes, the data shown in the window becomes stale or out-of-date, and the following message is displayed at the bottom of the window, between the Update and Close buttons.
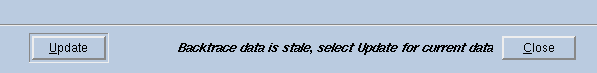 |
Use the Update button to refresh the data displayed.


