Debug > Memory Event Details
When a memory event occurs, the Memory Debugger automatically displays this window. After you dismiss it, you can redisplay it using this command.
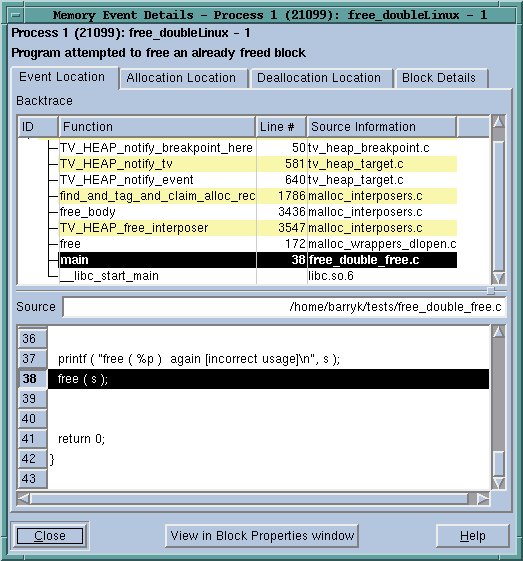
This window has four areas, as follows:

The top line tells you what type of error or event occurred.
The
Block Information area gives the memory location of the block and its status.
The third area contains the function backtrace if the error or event is related to a block allocated on the heap. The Memory Debugger retains information about the backtrace that existed when the memory block was allocated and the backtrace when it was deallocated. You can tell the Memory Debugger which it should display by selecting either the
Point of Allocation or
Point of Deallocation tab.
The bottom area shows you where the allocation or deallocation occurred in your program.
NOTE: In some cases, the Memory Debugger does not display an allocation backtrace. For example, if you try to free memory allocated on the stack or in a data section, there’s no backtrace because your program did not allocate the memory.
With a memory error, you can have up to three backtraces:
The allocation backtrace, which indicates where your program allocated a memory block. This only exists for memory created within the heap.
The deallocation backtrace, which indicates where your program freed a memory block. This only exists for memory created within the heap.
The current backtrace, which is the place where TotalView stopped your program. This is the backtrace currently being displayed within the Process Window.
If you need to redisplay the this window after you dismiss it, select the
Debug > Memory Event Details command.
For information on the Block Details tab, see
View > Examine Format > Raw.