The Stack
Memory in the stack section is dynamically managed by your program or operating system’s memory manager. Consequently, your program cannot allocate memory in the stack or deallocate memory in it.
NOTE >> “Deallocates” means that your program tells a memory manager that it is no longer using this memory. The next time your program calls a routine, the new stack frame overwrites the memory previously used by other routines. In almost all cases, deallocated memory, whether on the stack or the heap, just hangs around in its pre-deallocation state until it gets reassigned. |
The stack differs from the data section in that your program implicitly manages its space. What’s in it one minute might not be there a minute later. Your program’s runtime environment allocates memory for stack frames as your program calls routines and deallocates these frames when execution exits from the routine.
A stack frame contains control information, data storage, and space for passed-in arguments (parameters) and the returned value (and much more).
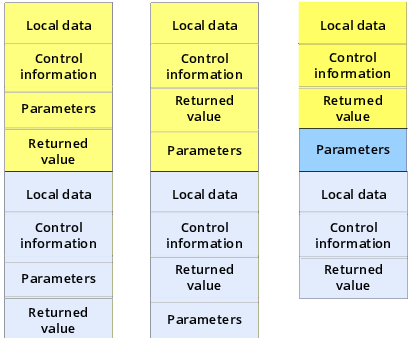
Figure 6 shows three ways in which a compiler can arrange stack frame information.
In this figure, the left and center stack frames have different positions for the parameters and returned value. The stack frame on the right is a little more complicated. In this version, the parameters reside in a stack memory area that doesn’t belong to either stack frame.
If a stack frame contains local (sometimes called
automatic) variables, where is this memory placed? If the routine has blocks in which memory is allocated, where on the stack is this memory for these additional variables placed? Although there are many variations,
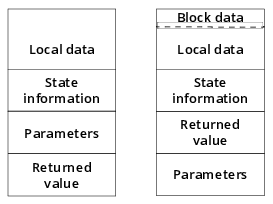
Figure 7 shows two of the more common ways to allocate memory.
The blocks on the left show a data block allocated within a stack frame on a system that ignores your routine’s block structure. The compiler figures how much memory your routine needs, and then allocates enough memory for all of a routine’s automatic variables. These kinds of systems minimize the time necessary to allocate memory. Other systems dynamically allocate the memory required within a routine as the block is entered, and then deallocate it as execution leaves the block. (The blocks on the right show this.) These systems minimize a routine’s size.
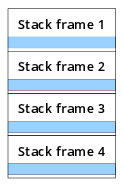
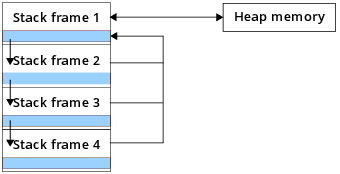
As your program executes routines, routines call other routines, placing additional routines on the stack.
Figure 8 shows four stack frames. The shaded areas represents local data.
What happens when a program passes a pointer to memory in a stack frame to lower frames?
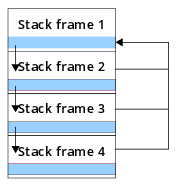
Figure 9 shows a program passing a pointer to memory in stack frame 1 down to lower stack frames.
In this figure, the arrows on the left represent an address contained within a pointer, an address that is passed down the stack. The lines and arrow on the right indicate the place to which the pointer is pointing. A pointer to memory in frame 1 is passed to frame 2, which passes the pointer to frame 3, and then to frame 4. In all frames, the pointer points to a memory location in frame 1. Stated in another way, the pointers in frames 2, 3, and 4 point to memory in another stack frame. This is the most efficient way for your program to pass data from one routine to another since your program passes the pointer instead of the actual data. Using the pointer, the program can both access and alter the information that the pointer is pointing to.
NOTE >> Sometimes you read that data can be passed “by-value” (which means copying it) or “by-reference” (which means passing a pointer). This really isn’t true. Something is always copied. “Pass by reference” means that instead of copying the data, the program copies a pointer to the data. |
Because the program’s runtime system owns stack memory, you cannot free it. Instead, your program’s runtime system frees it when it pops a frame from the stack.
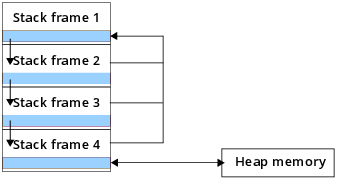
One of the reasons for memory problems is that it may not be clear which component owns a variable’s memory. For example,
Figure 10 shows a routine in frame 1 that has allocated memory in the heap, and which passes a pointer to that memory to other stack frames.
If the routine executing in frame 4 frees this memory, all pointers to that memory are dangling; that is, they point to deallocated memory. If the program’s memory manager reallocates this heap memory block, the data accessible by all the pointers is both invalid and wrong. Note that if the memory manager doesn’t immediately reuse the block, the data accessed through the pointers is still correct.
The timing of the reallocation and reuse of a block by another allocation request means there is no guarantee that the data is correct when the program accesses the block, and there is never a pattern to when the block’s data changes. Consequently, the problem occurs only intermittently, which makes it nearly impossible to locate. Worse, development systems usually are not as memory stressed as production systems, so the problem may occur only in the production environment.
Another common problem occurs when you allocate memory and assign its location to an automatic variable, shown in
Figure 11.
If frame 4 returns control to frame 3 without deallocating the heap memory it created, this memory is no longer accessible, and your program can no longer use this memory block. It has leaked this memory block.
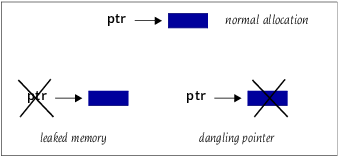
NOTE >> If you have trouble remembering the difference between a leak and a dangling pointer, the following figure may help. In both cases, your program allocates heap memory, and the address of this memory block is assigned to a pointer. A leak occurs when the pointer gets deleted, leaving a block with no reference. In contrast, a dangling pointer occurs when the memory block is deallocated, leaving a pointer that points to deallocated memory. Both are shown in Figure 12. |
MemoryScape can tell you about all of your program’s leaks. For information on detecting leaks, see
"Finding Memory Leaks".
