Adding, Deleting, Enabling and Disabling Filters
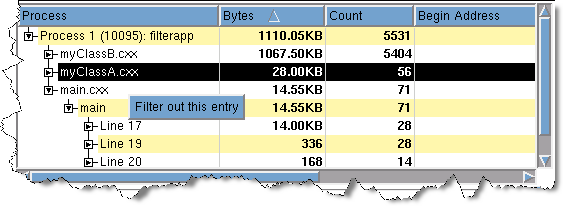
To begin filtering data, right-click on a routine name or line number in the top pane of a Leak Detection, Heap Status Source or Backtrace report, or in a Heap Status Graphical report, and select Filter out this entry from the context menu.
This command adds the routine to those that can be filtered. It does not actually enable filtering; enabling is done by selecting the Enable Filtering check box in the command area of many screens.
To apply the filter, select
Manage Filters, which is in the
Operations area on the left side of the screen,
Figure 66.
The controls in this dialog box:
 Enable/Disable
When checked, MemoryScape enables the filter.
Add
Displays the
Add Filter dialog box where you define a filter (discussed later in this section in
Adding and Editing Filters).
Edit
Displays a dialog box where you can change the selected filter’s definition. The displayed Edit Filter dialog box is identical to the Add Filter dialog box.
Remove
Deletes the selected filter.
 Up and Down
Moves a filter up or down in the filter list. Filters are applied in the order in which they appear, so you should place filters that remove the most entries at the top of the list. Filtering can be a time-consuming operation, so the right order can increase performance.
Enable All
Enables (checks) all filters in the list.
Disable All
Disables (unchecks) all filters in the list.


 Enable/Disable
 Up and Down