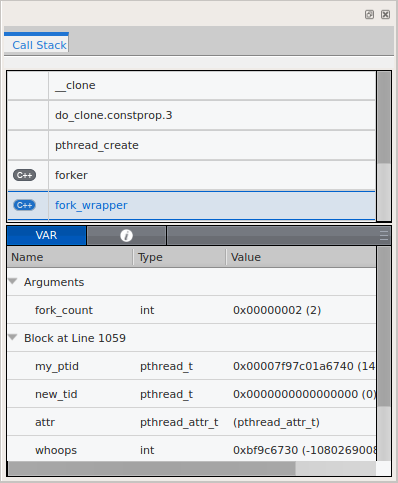
Call Stack View and Local Variables (VAR) Drawer
The display in the Call Stack view depends on which thread has the focus. That thread is highlighted in bold in the Processes and Threads view. You can double-click on a different line in the Processes and Threads view to change the focus to another thread.
The Call Stack view shows the stack trace for the thread in focus, allowing you to trace back through the execution of the thread. If the left column shows a language, source code is available and clicking on that stack entry displays the source code in a Source view at the location of the named function. if no language is shown, clicking on the stack entry still displays a Source view, but it simply says “No Source Available”.


