The Call Stack View and Local Variables
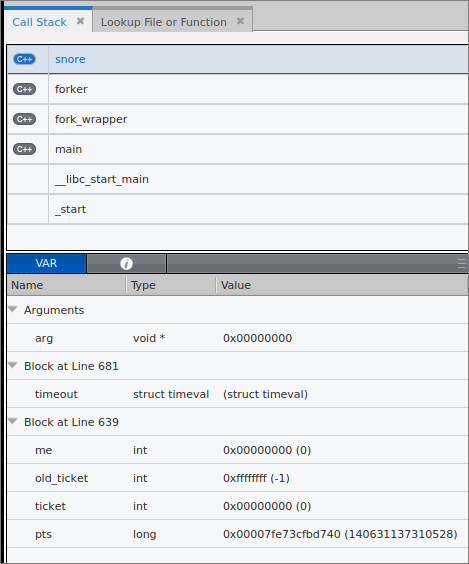
The Call Stack View consists of two panels, the Call Stack panel and the Local Variables (VAR) Panel (identified as “VAR” on the interface):
• The Call Stack panel shows the backtrace of the thread that is currently in focus and stopped, i.e. the Thread of Interest or TOI, bolded in the Process and Thread View:
To view the backtrace from a different thread, make a new thread selection in the Process and Thread View.
Note that the Call Stack displays the language and name of the program or function in focus:

• The VAR panel, or drawer, below the Call Stack panel displays all the arguments and local variables associated with the selected frame in the Call Stack view.
The
VAR drawer’s three columns display each variable’s
Name,
Type and
Value at the time that the thread stopped. For example, in
Figure 54, for selected function
snore, the local variables display under the associated scope or
program block.
NOTE >> The VAR drawer displays only scalar data; to drill down and view complex data, dive on the variable to add it to the Data View. See
"The Data View".
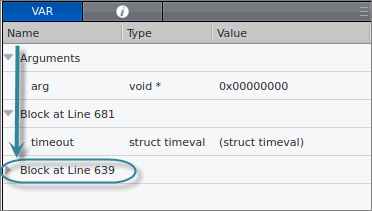
You can expand and collapse the list of variables in a block by clicking the left arrow next to it in the VAR drawer:

Placing your cursor over a variable displays its value in a tooltip:

• The
Information tab
on the VAR panel displays additional detail about the location of the stopped thread and the selected frame in the stack trace.
The info panel displays which function the selected stack frame is in, the source file containing that function, the line number where the PC is, and the Frame Pointer (FP) for the selected frame.
• Copy a variable definition from the NextGen TotalView for HPC UI to another document by right-clicking on the variable and selecting
Copy.

TotalView copies the variable as a tab-separated string so that pasting it into another program results in columns of data delineated by a tab.
