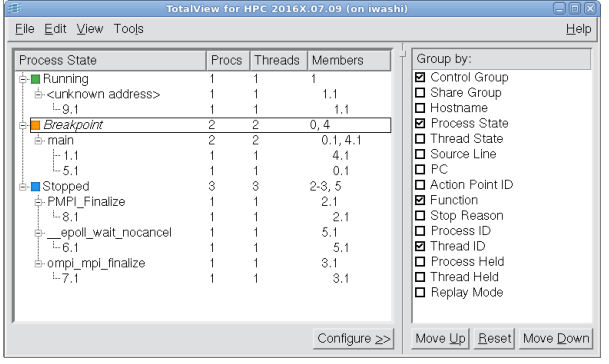
 |
 |
Process | Property Level | Description |
|---|---|---|
Control Group | Process | Control group of the processes in your job. Processes in the same job are placed in the same control group by default. If there is only one control group in the debug session, this property is omitted from the display. |
Share Group | Process | Share group of the processes within a control group. Processes that are running the same main executable are placed in the same share group by default. |
Hostname | Process | The hostname or IP address where the process is running. |
Process State | Process | The process execution state, e.g., Nonexistent, Running, Stopped, Breakpoint, Watchpoint, etc. The process execution state derives from the execution state of the threads it contains. |
Thread State | Thread | The thread execution state, e.g., Running, Stopped, Breakpoint, Watchpoint, etc. |
Function | Thread | The function name of the location of the stopped thread. Displays the function name or "<unknown address>" if the thread is running or the function name is not known. |
Source Line | Thread | The function name of the location of the stopped thread. Displays the source file name and line number or "<unknown line>" if the thread is running or the source line is not known. |
PC | Thread | The PC of the location of the stopped thread. Displays the program counter value or "<unknown address>" if the thread is running. |
Action Point ID | Thread | The action point (breakpoint or watchpoint) ID of the location of the stopped thread. Displays "Break (ID)", where ID is the action point ID or "none" if the thread is not stopped at an action point. |
Stop Reason | Thread | If stopped, the reason, for example due to a breakpoint or barrier point. |
Process ID | Process | The debugger process ID (dpid) of the process. Displays dpid. |
Thread ID | Thread | The dpid and debugger thread ID (dtid) of the thread. Displays dpid dtid. |
Process Held | Process | Indicates that a process is being held at a barrierpoint. |
Thread Held | Thread | Indicates that a thread is being held at a barrierpoint. |
Replay Mode | Process | Indicates that the process is in record mode. |
The CLI’s dstatus command’s -group_by switch |