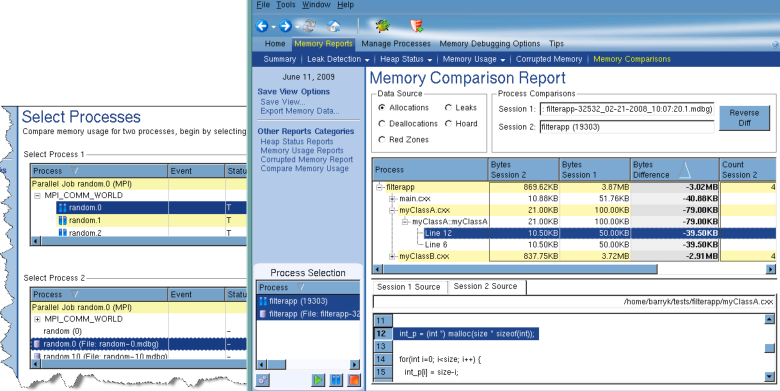
6. Select the two processes being compared. Note that the saved state has a small disk icon ( ) next to it. Figure 71 shows part of the screen containing controls for selecting the processes. The screen containing information is also displayed.
 ) next to it. Figure 71 shows part of the screen containing controls for selecting the processes. The screen containing information is also displayed.