Loading the CUDA Kernel
The executable that runs on the GPU is not available to the debugger until the CUDA kernel is launched. Therefore, you have to allow the host code to launch the CUDA kernel before you can plant breakpoints in CUDA GPU code.
To debug the CUDA GPU code, continue running the CUDA host code so that it executes the CUDA kernel invocation. For example, select "Go" on the process window to start running the CUDA host process. When the process executes the CUDA kernel invocation and loads the GPU executable onto the device, TotalView posts a dialog box as shown in
Figure 259.
Select "
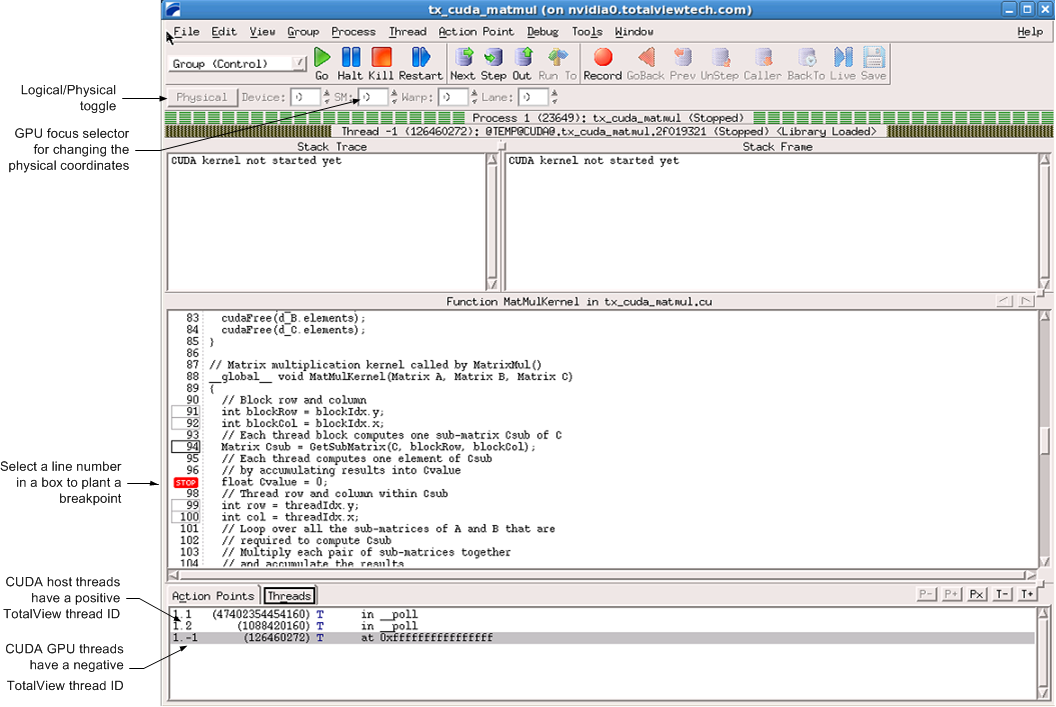
Yes" to plant breakpoints in the CUDA GPU code. The TotalView process window automatically refocuses on the CUDA thread showing the CUDA kernel ready to be executed,
Figure 260.
TotalView gives host threads a positive debugger thread ID and CUDA threads a negative thread ID. In the above example, the initial host thread in process "1" is labeled "1.1" and the CUDA thread is labeled "1.-1". In TotalView, a "CUDA thread" is a CUDA kernel invocation consisting of registers and memory, as well as a "GPU focus thread". Use the "GPU focus selector" to change the physical coordinates of the GPU focus thread.
There are two coordinate spaces. One is the logical coordinate space that is in CUDA terms grid and block indices: <<<(Bx,By,Bz),(Tx,Ty,Tz)>>>. The other is the physical coordinate space that is in hardware terms the device number, streaming multiprocessor (SM) number on the device, warp (WP) number on the SM, and lane (LN) number on the warp.
Any given thread has both a thread index in this 4D physical coordinate space, and a different thread index in the 6D logical coordinate space. These indices are shown in a series of spin boxes in the process window. If the button says “Physical” (
Figure 260), the physical thread number is displayed; if “Logical” (
Figure 262), the logical number. Pressing this button switches between the two numbering systems, but does not change the actual thread.
To view a CUDA host thread, select a thread with a positive thread ID in the Threads tab of the process window. To view a CUDA GPU thread, select a thread with a negative thread ID, then use the GPU thread selector to focus on a specific GPU thread. There is one GPU focus thread per CUDA thread, and changing the GPU focus thread affects all windows displaying information for a CUDA thread and all command line interface commands targeting a CUDA thread. In other words, changing the GPU focus thread can change data displayed for a CUDA thread and affect other commands, such as single-stepping.
Note that in all cases, when you select a thread, TotalView automatically switches the stack trace, stack frame and source panes, and Action Points tab to match the selected thread.


