Viewing Shared Objects
TotalView displays UPC shared objects, and fetches data from the UPC thread with which it has an affinity. For example, TotalView always fetches shared scalar variables from thread 0.
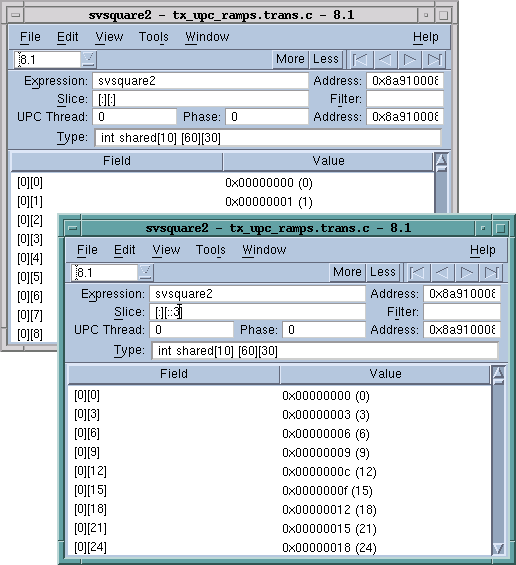
The upper-left screen in
Figure 242 displays elements of a large shared array. You can manipulate and examine shared arrays the same as any other array. For example, you can slice, filter, obtain statistical information, and so on. (For more information on displaying array data, see
Chapter 10, "Examining Arrays".) The lower-right screen shows a slice of this array.
In this figure, TotalView displays the value of a pointer-to-shared variable whose target is the array in the Shared Address area. As usual, the address in the process appears in the top left of the display.
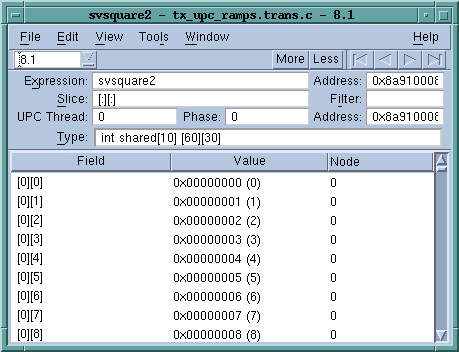
Since the array is shared, it has an additional property: the element’s affinity. You can display this information if you right-click your mouse on the header and tell TotalView to display Nodes.
You can also use the
Tools > Visualize Distribution command to visualize this array. For more information on visualization, see
"Array Visualizer".


