Stepping and Executing
The Process Window’s toolbar features buttons that control stepping and execution.
The following sections explore how these work using the wave_extended example.
NOTE >> These procedures on stepping and execution can be performed independently of the other tasks in this chapter, but you must first load the program, as described in
"Load the Program to Debug".
Simple Stepping
Here, we’ll use the commands Step, Run To, and Next, and then note process and thread status.
1. Step
— Select Step. TotalView stops the program just before the first executable statement, the method load_matrix().
All stepping functions are under the Process, Thread, and Group menus. So for the above, you could also select Process > Step, or just press the keyboard shortcut s — keyboard shortcuts are all listed under the above menus, and can considerably speed debugging tasks.
Note the yellow arrow that shows the current location of the Program Counter, or PC, in the selected stack frame.
The process and thread status are displayed in the status bars above the Stack Trace and Stack Frame panes:
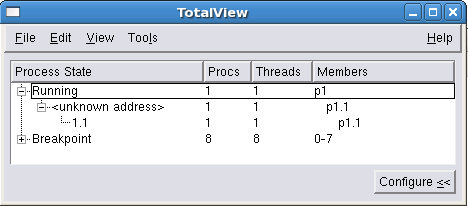
The Root Window also displays process/thread status. The Process State column displays the state of the thread:
You can also see that a single Process and Thread have been launched in the Process Window’s Thread tab at the bottom of the interface. (1.1 indicates one process and one thread.) If enabled, you can also see information about the process in the Processes tab.
The process is blue, meaning that it is stopped. If it were running, it would be green. A single thread has been spawned, which reports that it is in main().
— Select
Step again to
step into the function. (
Next would
step over, or execute the function, as described in
Step 3.)
TotalView goes into the load_matrix() function.
The Source Pane header reports that the program is in load_matrix(), and the PC is at printf().
2. Run To
— Select the set_values() function at line 91, then click Run To in the toolbar.
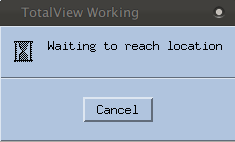
The program attempts to run to the selected line. Note that the PC does not change, and TotalView launches a popup:
Because the method set_values() is called after scanf(), the program is waiting for user input. From the shell that launched TotalView, enter 5 at the prompt “Please enter number of iterations”, then hit Return. (You can enter a different number, but a higher value will require you to wait over more iterations during later discussions.)
The PC stops at set_values().
3. Next
— Select Next. The program executes the for loop the number of times you input in the previous step, and then completes the program by printing “Program is complete.” to the console. (If you had instead selected Step, the program would have gone into the set_values() function.)
The Next command simply executes any executable code at the location of the PC. If that is a function, it fully executes the function. If the PC is instead at a location within a function, it executes that line and then moves the PC to the next line. For instance, below the PC is setting a variable value. In this case, Next executes line 71, and then moves the PC to line 72.
(Note that the array building the wave is not visible, as there is no program output. To examine or visualize data, including array data, we’ll use the Variable Window and the Visualizer, discussed in
"Examining Data" and
"Visualizing Arrays".)
To just run the program, select Go. This may be useful if you entered a larger number into the console, so you can avoid iterating through the for loop numerous times.


