Debugging Using the Command Line Interface (CLI)
The Command Line Interface (CLI) is a command-line debugger integrated with TotalView. You can use it and never use the TotalView GUI, or you can use it and the GUI simultaneously, which is the assumed approach in much of the documentation.
The CLI is embedded in a Tcl interpreter, so you can also create debugging functions that exactly meet your needs. You can then use these functions in the same way you use TotalView’s built-in CLI commands. You will most often use the CLI when you need to debug programs using very slow communication lines or when you need to create debugging functions that are unique to your program.
Start the CLI from the GUI using
Tools > Command Line in the Root or Process Windows, or directly from a shell prompt by typing
totalviewcli.
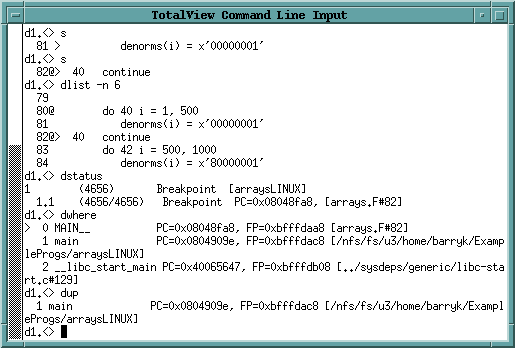
Figure 24 shows the CLI window debugging part of a program.
In the TotalView for HPC User Guide, CLI commands are frequently provided alongside GUI procedures, always within a gray box to be easily recognizable, for example:.
The command above saves your action points to a file, and is the equivalent of using the
Action Point > Save All command. The
TotalView for HPC Reference Guide details all the CLI commands.

