Option: Hoarding Memory Blocks
On this page:
When your program deallocates memory, it’s possible that a pointer still points to the deallocated block. If your program then tries to access that block, the data can become corrupt. To give you more options to identify problems like dangling pointers or other issues with deallocation, you can hoard memory blocks.
Hoarding memory simply means that TotalView doesn’t immediately release memory that has been deallocated; instead, it records the size of the block that would have been deallocated, and your program can continue accessing that memory for a defined amount of time.
How Hoarding Works
TotalView holds on to hoarded blocks for a specific amount of time before returning them to the heap manager for reuse. As TotalView adds blocks to the hoard, it places them in a first-in, first-out list. When the hoard is full, TotalView releases the oldest blocks back to your program’s memory manager.
When hoarding is turned on, deallocated memory isn’t available to be overwritten by your program, which allows your program to continue running normally even though it might be accessing memory that should have been deallocated. This can help uncover related errors, and these errors can help you track down the problem.
For example, if you are both painting memory and hoarding deallocated memory, you might be able to force an error when your program accesses the painted memory.
Consider a couple of examples.
Finding a Multithreaded Problem
When a multithreaded program shares memory, problems can occur if one thread deallocates a memory block while another thread is still using it. Because threads execute intermittently, these kinds of deallocation problems may not be immediately apparent. If you hoard memory, however, the memory stays available for longer because it cannot be reused immediately.
In this case, if intermittent program failures stop occurring, you’ll be able to identify the problem more easily.
One advantage of this technique is that you can relink your program (see Linking Your Application with the HIA) and then run TotalView against a production program that was not compiled using the -g compiler debugging option. If you see instances of the hoarded memory, you’ll instantly know problems have occurred.
This technique often requires that you increase the number of blocks being hoarded and the hoard size.
Finding Dangling Pointer References
Hoarding is most often used to find dangling pointer references. Once you know the problem is related to a dangling pointer, you need to locate where your program deallocated the memory. One technique is to use block tagging (see Memory Block Notification) to stop execution when memory is allocated or deallocated. Another is to use block painting (see Option: Painting Memory to write a pattern into deallocated memory. If you also hoard painted memory, the heap manager cannot reallocate the memory as quickly.
For example, if the memory were not hoarded, the heap manager could reallocate the memory block at which point a program can legitimately use the block, changing the data in the painted memory. If this occurs, the block is both legitimately allocated and its contents are legitimate in some context. However, the older context was destroyed. Hoarding delays the recycling of the block. In this way, it extends the time available for you to detect that your program is accessing deallocated memory.
Enabling and Configuring Hoarded Memory
Enable memory hoarding from either the Program Session page in the Session Editor or from the Debug menu after your debugging session has started.
The option available from the Debug menu also reports hoard status, once your program is running:
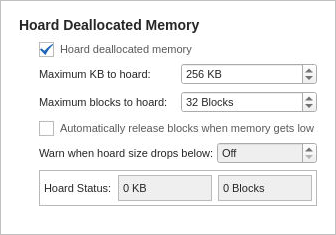
Maximum KB to hoard:
The default is 256 KB. To hoard all deallocated memory, enter 0, which will then display “Unlimited.”

Maximum blocks to hoard:
The default is 32 blocks. Enter 0 to hoard an unlimited number of blocks.
Automatically release blocks when memory gets low:
If choosing “Unlimited” in the above options, consider also selecting this option to prevent or delay your program running out of memory.
Warn when hoard size drops below:
If blocks are automatically being released for low memory, you can also choose to have TotalView warn you if the hoard size drops below a certain number, in which case TotalView halts execution and notifies you. You can then view a heap or leak report to see where your memory is being allocated. Choose this option, then enter a value, for example:

Hoard Status:
Reports the block hoarding status as your program runs.
Example: Hoarding Memory
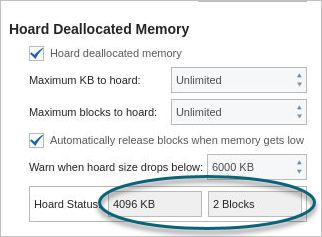
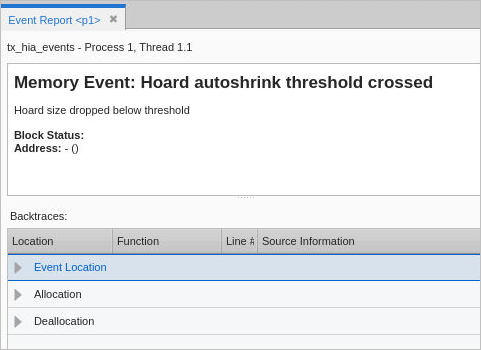
Consider this program in which the maximum blocks to hoard and their size has been set to “unlimited,” along with a warning when hoard size drops below 6,000 KB. During program execution, if the hoard threshold is crossed, a memory event is written to the Event Report:
In addition, the Memory Options dialog reports hoard status: