Option: Painting Memory
On this page:
Your program may be using memory either before it is initialized or after it is deallocated. TotalView can help identify these kinds of problems by initializing allocated or deallocated memory to a bit pattern. This is called painting. Recognizing this bit pattern can help more quickly identify the problem.
Painting memory blocks is useful in:
Identifying the use of uninitialized or deallocated memory. The bit pattern immediately tells you that memory is either allocated or deallocated.
Ensuring consistency for multiple users, i.e., if a program works for some users and not for others, it will be clear if uninitialized or deallocated memory is the problem.
Changing your program’s behavior if it is not using memory correctly, which can help in identifying the problem. In addition, it may correct the problem so that the program doesn’t appear to fail.
Forcing an error such as a crash to occur, which can in turn help you identify the problem.
Finding initialized memory by searching for the bit pattern to ensure all memory was correctly initialized.
Enabling and Configuring Painting
Enable memory painting from either the Program Session page in the Session Editor or from the Debug menu after your debugging session has started.
Figure 197. Enabling Memory Painting in the Session Editor
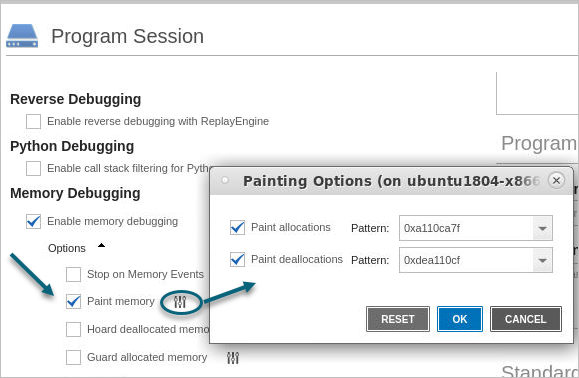
To customize the pattern used for painting, select the options (![]() ) icon to open the Painting Options dialog:
) icon to open the Painting Options dialog:
Paint allocations pattern:
The default is 0xa110ca7f, chosen for its resemblance to the word “allocate.”
Paint deallocations pattern:
The default is 0xdea110cf, chosen for its resemblance to the word “deallocate.”
Example: Viewing Painted Memory
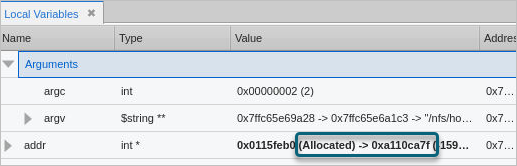
If you turn on memory block painting before starting your program, you’ll be ready to observe memory being allocated or deallocated. For example, the variable addr has not yet been allocated:
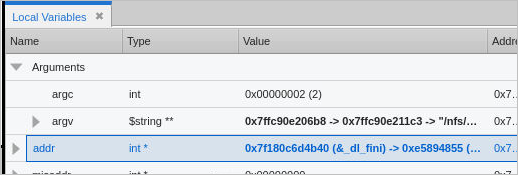
After allocation, note the bit paint value: