Slicing Arrays
You can slice an array when you want to generate statistics or view data on a sub-portion of the array. By creating a slice, you remove the parts of the array you do not want to see.
On this page:
Adding a Slice to an Array
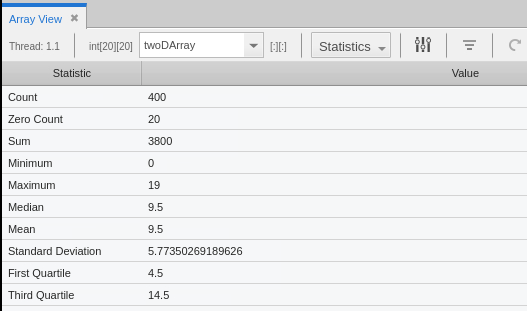
Consider a two-dimensional array containing 400 elements.
To slice the array, click ![]() on the Array View toolbar to open the Configuration Options dialog.
on the Array View toolbar to open the Configuration Options dialog.
The general form for a slice definition is as follows:
lower_bound:upper_bound[:stride]
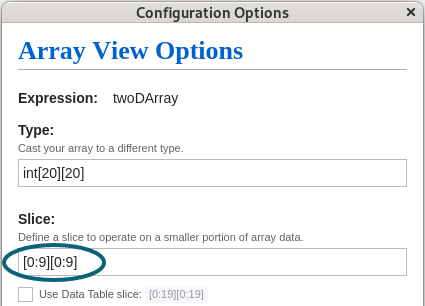
For example, for a 2D array, a slice of [0:9][0:9] would use only elements 0 through 9 of each dimension, cutting the number of elements used to calculate the statistics to 100.
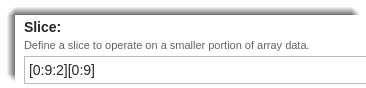
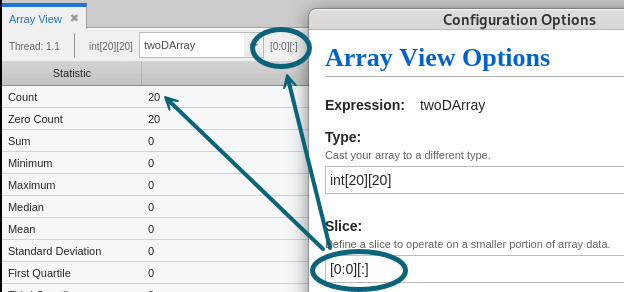
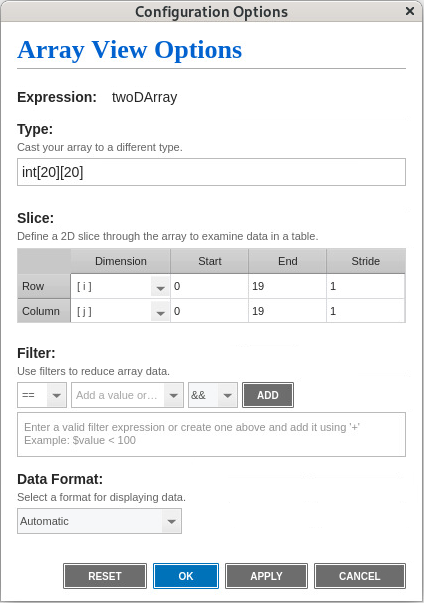
To create this slice, enter the slice values as shown in Figure 71.
Figure 71. Enter the slice values
After you enter your slice values, you can:
-
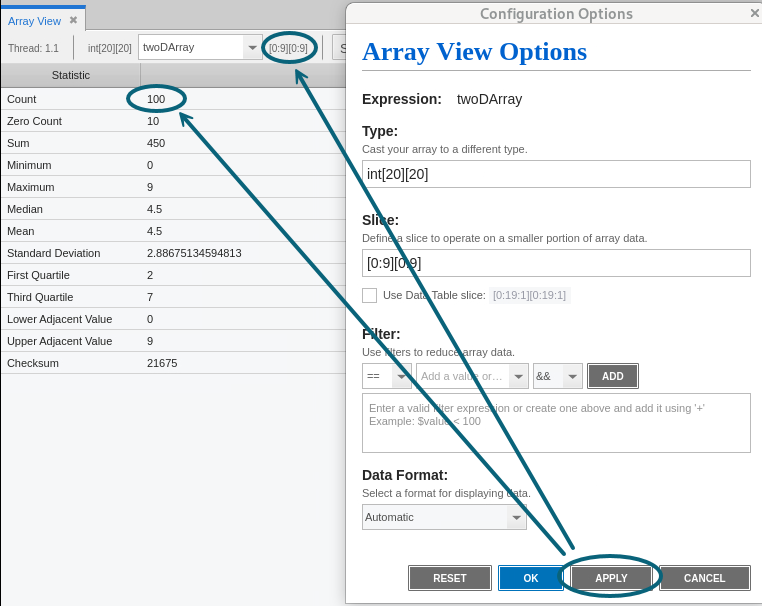
Click Apply to view your changes immediately in the Array View; the dialog box remains open so you can continue testing different slices.
-
Click OK to apply and save your changes; the dialog box closes automatically.
-
Select Reset to cancel your changes; the dialog box resets to the array's original settings, and you can then click Apply to re-set the Array View to the non-sliced presentation.
Adding a Stride to an Array
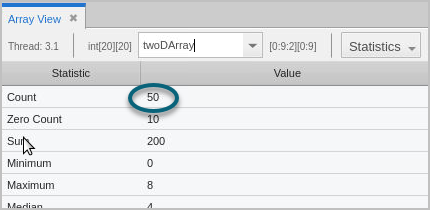
The default value for stride is 1; that is, show all elements in the range. If you add a stride of 2 to one of the dimensions, the statistical calculations use every other element, cutting the number of elements to 50.
As noted in the previous section, the form for a slice definition is as follows:
lower_bound:upper_bound[:stride]
Therefore, to add a stride of 2 to one of the dimensions in the previous slice example, enter the stride value in the Configuration Options dialog, as follows.
Slicing or adding a stride to an array is reflected in the Statistics view and all data views, except for the Data Table view. To add a slice or stride to the Data Table view, see Adding a Slice and Stride to the Data Table View.
Statistics view
Line Plot view
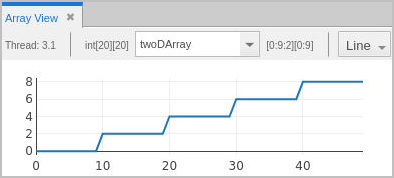
Figure 72. Histogram Plot view
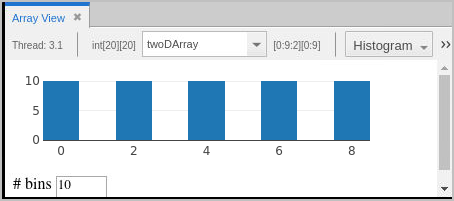
Figure 73. Surface Plot view
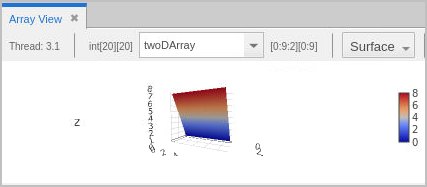
To view or analyze the stats of just the second dimension of the array, you could hold the first dimension steady, for example, [0:0][:].
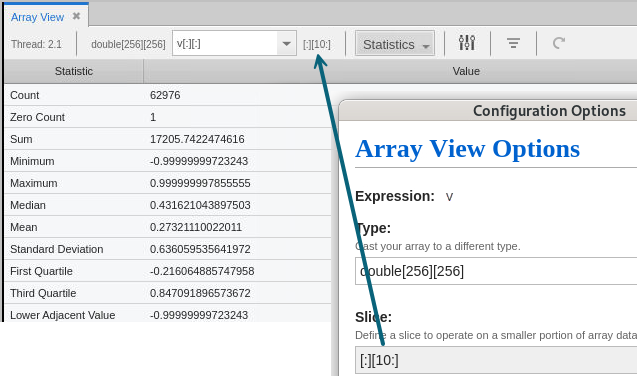
In this different 2D array, the slice includes all elements from the first dimension, but only the 10th element from the second dimension.
Slicing Using the Zoom Tool
You can also use the zoom tool to select an x-axis or y-axis range.
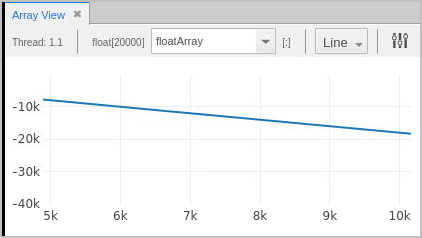
The following image shows a 20,000-element, single-dimensional array. To see just the values from 5,000 to 10,000, select the slice by clicking at the starting point of the range and then dragging to the end range.
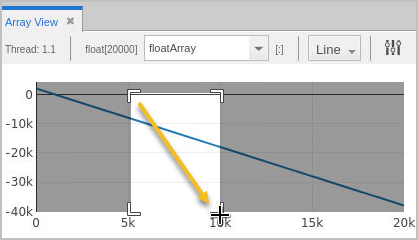
This slices the display, like so:
Adding a Slice and Stride to the Data Table View
See the following two examples to learn how to add a slice and stride to your 2D and 3D arrays:
Example: 2D Array
Consider a two-dimensional array containing 400 elements.
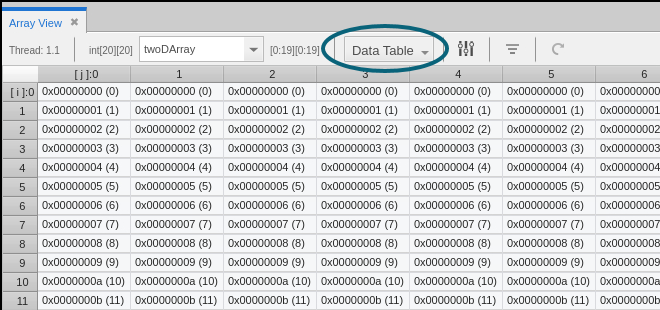
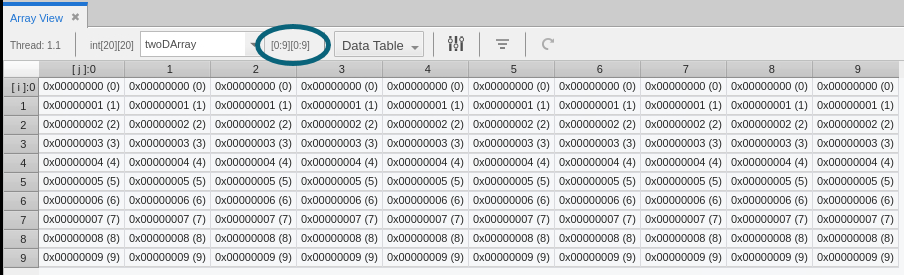
When you switch to the Data Table view, the array data is displayed in table format, as follows.
To create a slice, click ![]() on the Array View toolbar to open the Configuration Options dialog.
on the Array View toolbar to open the Configuration Options dialog.
In this default representation of the array, each dimension (i and j) shows all elements 0 through 19 (that is, a slice of [0:19][0:19]).
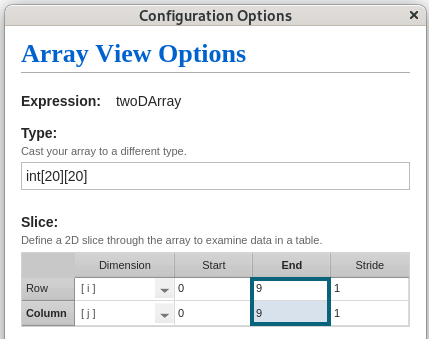
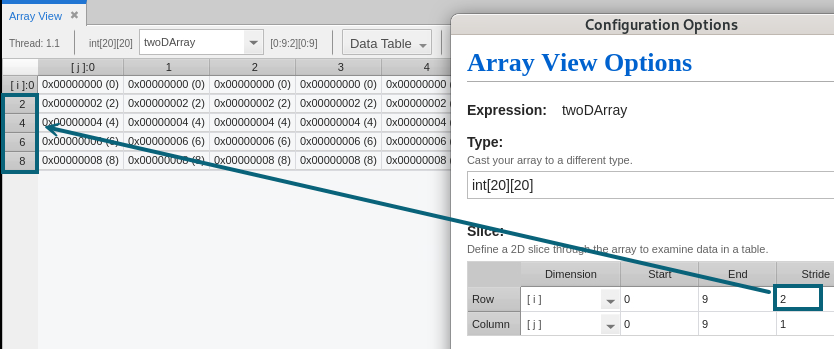
To define a slice of [0:9][0:9], which would use only elements 0 through 9 of each dimension and cut the number of elements used to calculate the statistics to 100, double-click in each End cell in the table and enter the slice values as shown in Figure 74.
Figure 74. Enter the slice values
After you enter your slice values, you can:
-
Click Apply to view your changes immediately in the Array View; the dialog box remains open so you can continue testing different slices.
-
Click OK to apply and save your changes; the dialog box closes automatically.
-
Select Reset to cancel your changes; the dialog box resets to the array's original settings, and you can then click Apply to re-set the Array View to the non-sliced presentation.
When you click apply, the Array View updates to display only the slice data.
To add a stride of 2 to one of the dimensions in the previous slice example, enter the stride value in the Configuration Options dialog as follows, and then click Apply. The array stride is updated in the Data Table view.
Example: 3D Array
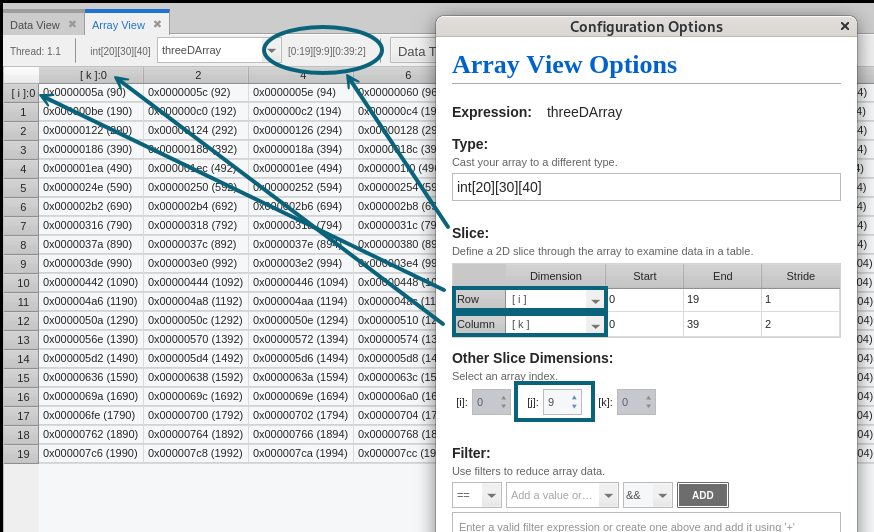
Figure 75 shows the Configuration Options dialog when opened from the Table Data view for a 3D array. Note the additional settings for Other Slice Dimensions.
Figure 75. Configuration Options dialog for a 3D array
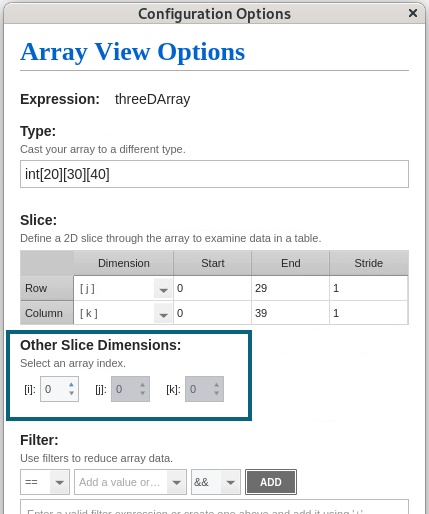
For this 3D array, use the Dimension dropdown controls in the Slice table to specify which dimensions of the array you want to display in the Array View. You can place a slice on one or both of the dimensions by entering the slice start and end values. You can also place a stride on one or both of the dimensions by entering a stride value.
Use the Other Slice Dimensions control to specify the index to hold steady for the dimension that you are not including in the two-dimensional display in the Array View (in this example, the j dimension).
Click Apply to update the array data in the Data Table view.