Customize the Display
Use the Configure panel to “group by” selected attributes
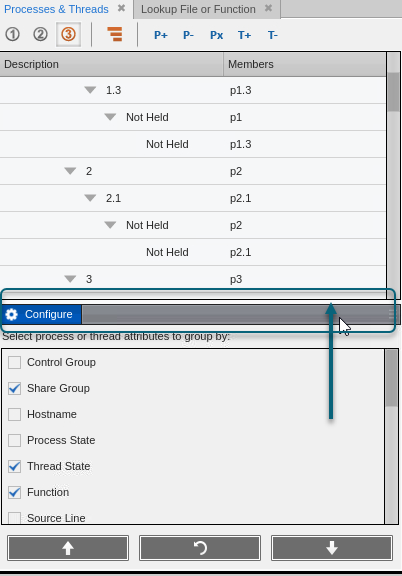
The Configure panel displays process and thread attributes by which you can group the display.
If the panel is not visible, drag the panel header to open it.

Checked selections appear in the View pane in the order that they appear in the “Group by” list. To change the order, select items in the list and use the up and down arrows. Reset restores the initial order. To hide the list, double-click its banner.
The Processes & Threads View Layout
For more information on ptlists, see "Compressed List Syntax (ptlist)" in the TotalView Reference Guide.


