Corrupt Guard Block Reports
When your program allocates a memory block, no data should be written outside the block. For instance, an allocation of 16 bytes could not accommodate 32 bytes of information, as that data would write over the information in the next block, corrupting it.
If you enable guard blocks—by selecting the option “Guard Allocated Memory” either in the Session Editor or from the Debug menu—TotalView writes small blocks of information before and after all blocks that your program allocates. These additional blocks are called guard blocks and are 8 bytes of memory initialized with a specific bit pattern (although this can be customized). See Enabling and Configuring Guard Blocks for details.
If your program writes data into either of the guard blocks, it will result in corrupted data. View these corrupt memory blocks in two ways:
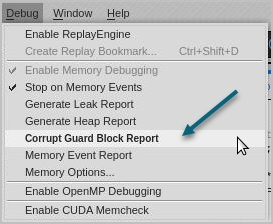
To run a Corrupt Guard Block Report, stop your program and choose Debug > Corrupt Guard Block Report, or press the memory toolbar button ( ) “Generate a Corrupt Guard Block report”.

The report opens, displaying the files, the methods, and the specific lines in which any corrupted guard block exists. Like other reports, selecting an entry in the top pane focuses the Backtrace pane and the Source pane on that line.
NOTE: Remember that this report displays where the guard blocks were allocated; it cannot actually identify where the overwrite occurred in your program. Strategies for locating the overwrite would entail rerunning your program and focusing on the block where the corrupt memory occurred. In addition, you might use watchpoints and ReplayEngine together by placing a watchpoint on the corrupt guard block address and then playing your program backward to the location where the watchpoint is triggered.
Figure 182, Corrupt Guard Block Report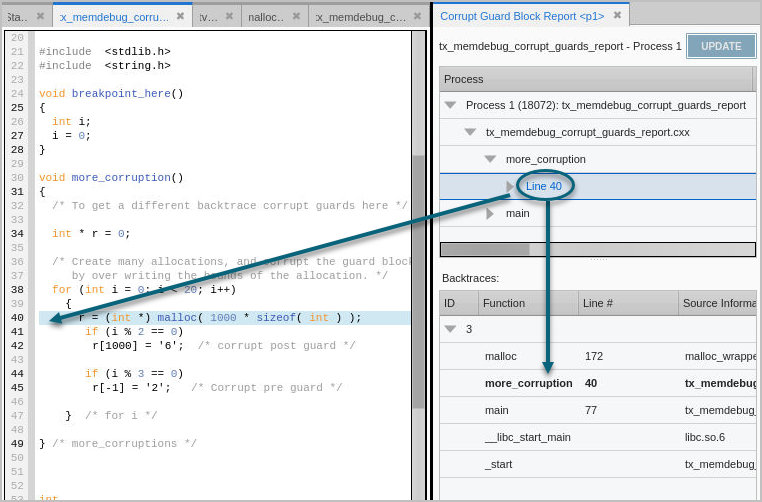
Drill down into the line in the top pane to see detail about the memory block, whether the pre- or post-guard blocks were overwritten, or both.
Figure 183, Corrupt Guard Block Report, viewing detail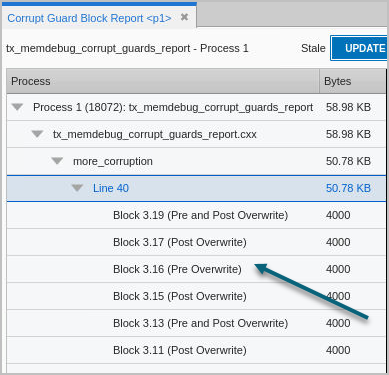
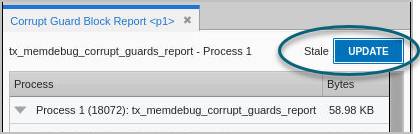
Updating the Report
If you are stepping through your code or it has stopped at a breakpoint, the Corrupt Guard Block Report does not update automatically. At this point, the Update button becomes active; select it to update the report.