Undocking and Docking
Any view can be undocked into a separate, floating window by clicking on the top banner, dragging it a short distance, and releasing the mouse button. To dock the view elsewhere, click again and drag it to another location, wait for a blank area to display, then release the mouse button.
Figure 2, Docking a View in a New Location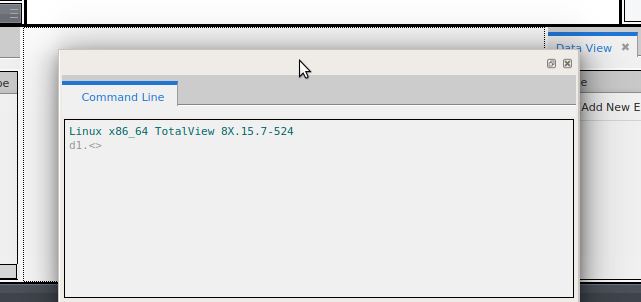
To return a floating window to its default position, double-click its banner or click the reattach icon  in the top-right corner next to the close (x) icon.
If you close the view, you can restore it using the Window | Views menu, or the context menu available by right-clicking in the toolbar area.


