Configuring Arrays
Use the Array Configuration Options dialog to isolate and view a smaller portion of data by either slicing the array or adding strides as well as editing the array’s type.
To open this dialog, select the Array Configuration button ( ) from the Array View.
Figure 74, Array Configuration Options dialog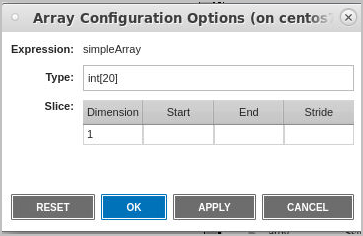
Here, enter a slice and/or stride to view a portion of an array.
Selecting different arrays in the Array View automatically updates the display in the Array Configuration Options dialog. The table in the dialog also updates to reflect the number of dimensions in the array.


