Visualizing Array Data
To visualize your data, choose either Histogram Plot, Line Plot, or Surface Plot from the Statistics dropdown.
Different datasets can require different views to display their data. For example, you could use a histogram to see the distribution of a dataset, or lines and surface plots to view trends or slope.
The examples here display all the data for an array. To display a subset, you can slice the data. See Slicing Arrays.
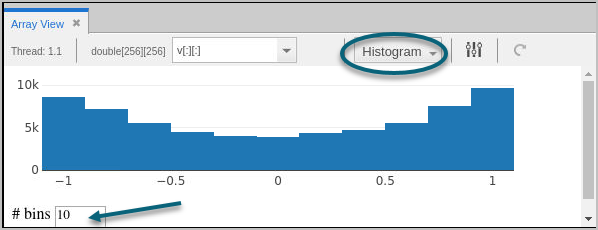
Histogram View
By default, the view displays 10 bins, or buckets:
 |
Change the number of bins to evaluate a different dataset distribution: 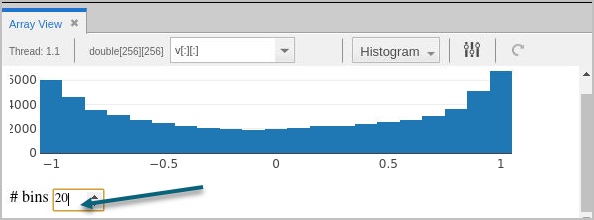 |
Line Plot View
To display your data as x and y coordinate pairs, use the Line Plot view. This view is useful to plot trend lines in your one-dimensional datasets. For example:
Figure 71, Array Data > Line Plot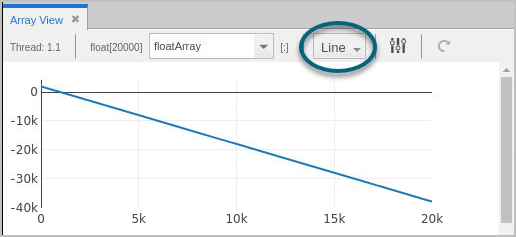
Note that for higher-dimensional datasets in the Array View, the Line Plot displays a flattened, one-dimensional dataset. For example, given an array like this:
[[31 12 43][42 1 16
[0 42 0]]
The Line Plot displays a flattened array, like so:
[31 12 43 42 1 16 0 42 0]
Surface Plot View
The Surface plot displays two-dimensional datasets as a surface in two or three dimensions. The dataset’s array indices map to the first two dimensions (X and Y axes) of the display, and the values map to the height (Z axis). This can be useful to show a relationship across three variables and to observe trends in two-dimensional datasets.
NOTE: Surface plot display is supported only on Linux-x86-64, Linux ARM64, and macOS, and requires OpenGL version 2.1 or greater.
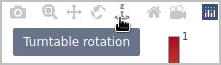
Figure 72, Array View: Surface Plot View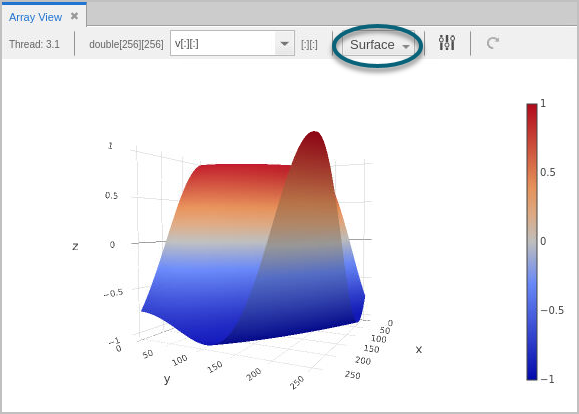
Use the plot controls to rotate or zoom the display.
Updating the View
After advancing your program, the view does not update automatically. To refresh the display, click the Update button ( ).
).
Changing the Thread of Focus
if you change the program’s thread of focus, it’s not reflected in the array displayed in the Array View, which displays the original thread of focus when the array was added to the view. You can, however, maintain multiple arrays in the Array View that are tied to different threads of focus.
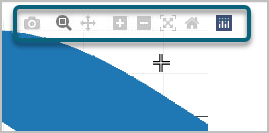
Zooming Into Data
To view some data in detail, use the zoom toolbar, which displays when you place your cursor inside the graph:
 ).
).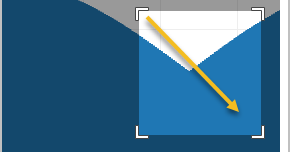
TotalView zooms in on your data:
Figure 73, Array View > zooming in on data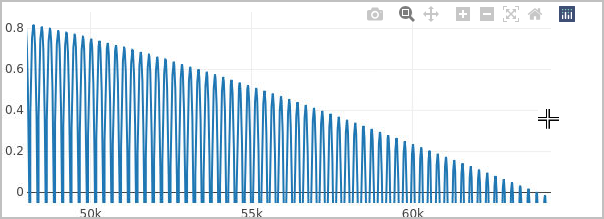
To undo the zoom, either double-click on the graph or select the Reset Axes home button ( ) or the Zoom out button (
 ).
).
) or the Zoom out button (). If you know the indices you want to examine, you can also slice the array to view a subsection; see Slicing Arrays.
Slicing arrays to visualize or see statistics for a subsection of an array | |
Viewing arrays in the Data View | |
Displaying arrays |


