Parallel Backtrace View
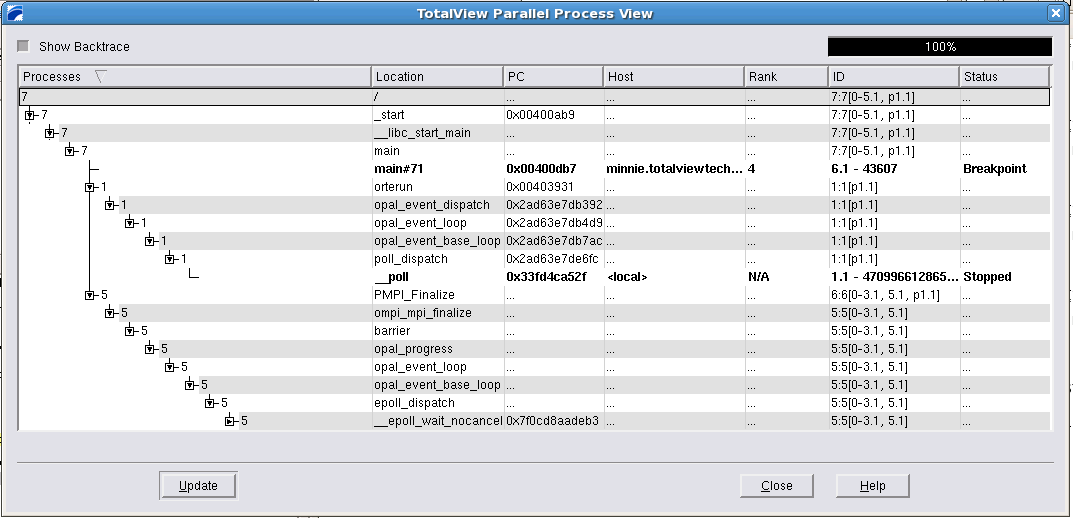
The Parallel Backtrace View displays in a single window the state of every process and thread in a parallel job, including the host, status, process ID, rank, and location. In this way, you can view thousands of processes at once, helping identify stray processes.
Access the Parallel Backtrace View from the Tools menu.
 |
The Parallel Backtrace View shows the position of a program’s processes and threads at the same time, displayed as a branching tree with the number and location of each process or thread at each point, as follows:
Diving (with the right mouse button) on each expanded item displays its process window
 |
The progress indicator in the upper right reports the progress of collecting and displaying information.
 |
Using the Show Backtrace toggle in the upper left hides the intervening branches and displays the start routine and current execution location of the processes or threads. This removes some of the clutter in the display, as shown above.
If a thread/process state changes, the data becomes stale, and an alert is displayed at the bottom of the window, Figure 173.
 |
Use the Update button to refresh the display.
The dcalltree command | dcalltree in “CLI Commands” in the Classic TotalView Reference Guide |


