Error Notifications
When your program uses a function from the malloc library, MemoryScape intercepts the call using a process called interposition (see Behind the Scenes). If the action is an allocation, MemoryScape records information about it. If your program is deallocating a block, MemoryScape looks for the block in its table. Based on what it finds, it can stop execution and notify you that a problem is about to occur. For example, if the block was previously deallocated, MemoryScape can stop execution and tell you about the problem.
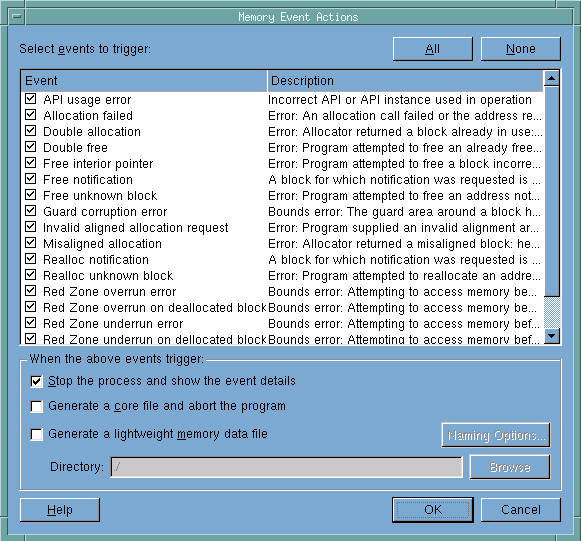
For information on which events stop execution, see the help or examine the contents of the dialog box displayed when you click the Advanced button on the Memory Debugging Options Advanced screen.
Figure 55: Memory Event Notification |
 |
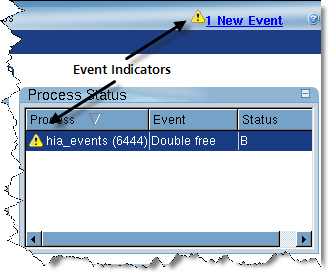
If an event occurs, MemoryScape stops execution and places an event indicator on the screen, Figure 56.
Figure 56: Event Indicator |
 |
You can now display the Manage Processes| Process Event screen. MemoryScape will take you directly there if you click on the event link, Figure 57.
Figure 57: Process Events Screen |
 |
You are now ready to look for detailed information about the notification event. The top of the window (the text in bold) describes the event. Immediately below this text are four tabs: Event Location, Allocation Location, Deallocation Location, and Block Details. The information in the first three is of the same kind as that shown in Figure 57.
When MemoryScape intercepts a call to the malloc library, it also records the backtrace associated with the function call (that is, it records the function’s call stack). Depending on the event, one or more of these four tabs will have data. For example, if you try to free stack memory, the only location that MemoryScape knows about is the place where the event occurred.
To assist you in locating a problem, MemoryScape saves some of the code surrounding the line in your program that caused the event.
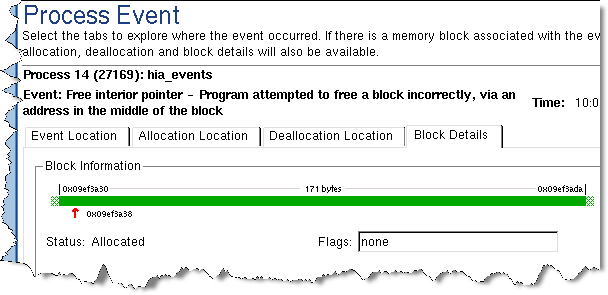
The Block Details tab presents information about this event in a different form. This tab is very useful for obtaining additional information about the block, Figure 58.
Figure 58: Block Details Tab |
 |


