Viewing Options
The Visualizer shows either a Graph view (2-D plot) or Surface view (3-D plot) of your data. (If the array is one-dimensional, only the Graph view is available. The Graph view is not discussed here.)
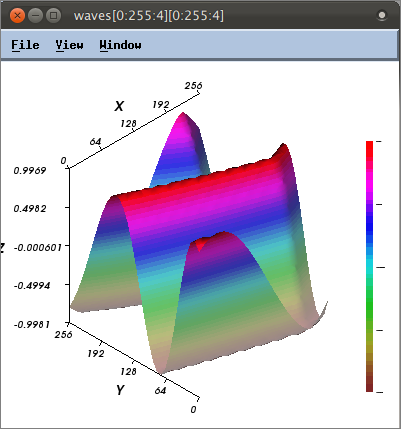
By default, it shows a Surface view for most two-dimensional data, and that is what it shows for the waves array.
The Surface view displays two-dimensional datasets as a surface in two or three dimensions. The dataset’s array indices map to the first two dimensions (X and Y axes) of the display, and the values map to the height (Z axis).
You can further refine the Surface view using the View window’s options. Select File > Options from the View window to launch the Options dialog.
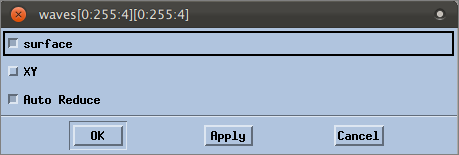 |
Possible options are:
For example, click surface, then click OK. The view changes from a grid to a 3-D:
 |
The Visualizer has many more options with various other viewing modes and tools. See the Related Topics below for references to further discussions.
This completes this tutorial on basic debugging.
More on the Visualizer | |
Visualizer options | |
The Array Viewer (another way of looking at arrays) | |
Displaying slices of arrays | |
Filtering array data |


