Using the Graph Window
The Graph Window displays a two-dimensional graph of one- or two-dimensional datasets. If the dataset is two-dimensional, the Visualizer displays multiple graphs. When you first create a Graph Window on a two-dimensional dataset, the Visualizer uses the dimension with the larger number of elements for the X axis. It then draws a separate graph for each subarray that has the smaller number of elements. If you don’t like this choice, you can transpose the data by selecting a checkbox within the File > Options Dialog Box.
NOTE: You probably don’t want to use a graph to visualize two-dimensional datasets with large extents in both dimensions as the display can be very cluttered. If you try, the Visualizer shows only the first ten.
You can display graphs with points for each element of the dataset, with lines connecting dataset elements, or with both lines and points, as demonstrated in Figure 178.
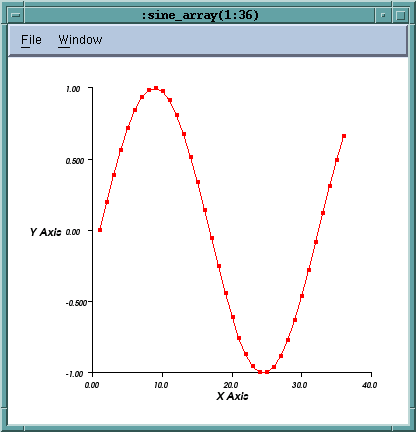 |
If the Visualizer is displaying more than one graph, each is a different color. The X axis is annotated with the indices of the long dimension. The Y axis shows you the data value.


