Setting Machine-Level Breakpoints
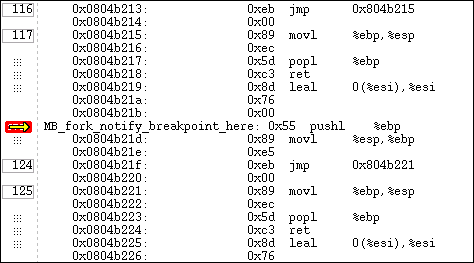
To set a machine-level breakpoint, you must first display assembler code. You can now select an instruction. TotalView replaces some line numbers with a dotted box ( )—this indicates the line is the beginning of a machine instruction. If a line has a line number, this is the line number that appears in the Source Pane. Since instruction sets on some platforms support variable-length instructions, you might see a different number of lines associated with a single line contained in the dotted box. The
  icon appears, indicating that the breakpoint occurs before the instruction executes.
 )—this indicates the line is the beginning of a machine instruction. If a line has a line number, this is the line number that appears in the Source Pane. Since instruction sets on some platforms support variable-length instructions, you might see a different number of lines associated with a single line contained in the dotted box. The
 If you set a breakpoint on the first instruction after a source statement, however, TotalView assumes that you are creating a source-level breakpoint, not an assembler-level breakpoint.
 |
If you set machine-level breakpoints on one or more instructions generated from a single source line, and then display source code in the Source Pane, TotalView displays an  icon (Figure 88) on the line number. To see the actual breakpoint, you must redisplay assembler instructions.
 icon (Figure 88) on the line number. To see the actual breakpoint, you must redisplay assembler instructions.
When a process reaches a breakpoint, TotalView does the following:
 |
Displaying assembler code | |
Barrier points |


