About Action Points
Actions points specify an action to perform when a thread or process reaches a source line or machine instruction in your program. TotalView provides four types of action points:
When a thread encounters a breakpoint, it stops at the breakpoint. Other threads in the process also stop. You can indicate that you want other related processes to stop, as well. Breakpoints are the simplest kind of action point.
Barrier points are similar to simple breakpoints, differing in that you use them to synchronize a group of processes or threads. A barrier point holds each thread or process that reaches it until all threads or processes reach it. Barrier points work together with the TotalView hold-and-release feature. TotalView supports thread barrier and process barrier points.
An eval point is a breakpoint that has a code fragment associated with it. When a thread or process encounters an eval point, it executes this code. You can use eval points in a variety of ways, including conditional breakpoints, thread-specific breakpoints, countdown breakpoints, and patching code fragments into and out of your program.
A watchpoint tells TotalView to either stop the thread so that you can interact with your program (unconditional watchpoint), or evaluate an expression (conditional watchpoint).
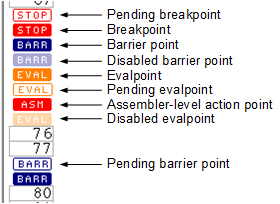
The different kinds of action points that you can use are shown in Figure 88.
Action Point Properties
All action points share the following common properties.
Action Point Status Display
In the Process Window, each action point is identified by a symbol:
 |
The  icon is displayed when you create a breakpoint on an assembler statement.
icon is displayed when you create a breakpoint on an assembler statement.For information on pending breakpoints, see Pending Breakpoints.
CLI: dactions -- shows information about action points All action points display as “@” when you use the dlist command to display your source code. Use the dactions command to see what type of action point is set. |
When your program halts because it encounters an action point, TotalView reports status in several locations. In the Root Window, the Process State is displayed with Breakpoint as well as the letters ap followed by a number if the Action Point ID checkbox is enabled in the Configure pane. This is the same number as in the Action Points tab within the Process Window. In the Process Window, the status lines above the Source Pane also let you know that the thread is at a breakpoint. Finally, TotalView places a yellow arrow over the action point’s icon in the Action Point tab. For example:
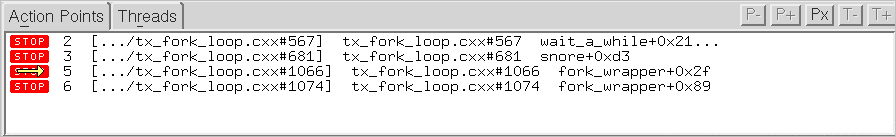 |
For templated code, an ellipsis (...) is displayed after the address, indicating that additional addresses are associated with the breakpoint.
Manipulating Action Points
When working with action points, you can use your mouse to quickly manipulate breakpoints. In the line number area of the Source Pane, a left mouse click sets a breakpoint at that line, displaying a  icon instead of a line number.
icon instead of a line number. Selecting the  icon a second time deletes the breakpoint. If you change any of the breakpoint’s properties or if you’ve created an eval point (indicated by an
  icon), selecting the icon disables it.
icon a second time deletes the breakpoint. If you change any of the breakpoint’s properties or if you’ve created an eval point (indicated by an icon), selecting the icon disables it.Modifying action point properties | The Action Point > Properties dialog box in the in-product Help |
Using action points with the CLI |


