Examining Memory
So far, you’ve been reading about memory errors. If only things were this simple. The large amount of memory available on a modern computer and the ways in which an operating system converts actual memory into virtual memory may hide many problems. At some point, your program can hit a wall—thrashing the heap to find memory it can use or crashing because, while memory is available, the operating system can’t find a block big enough to contain your data. In these circumstances, and many others, you should examine the heap to determine how your program is managing memory.
NOTE >> MemoryScape can display a lot of information, at times too much. You can simplify MemoryScape reports using a filter that suppresses the display of information. For more information on filters, see Task 10: Filtering Reports. |
Begin analyzing data by displaying the Memory Reports | Heap Status | Graphical Report. After generating the report, MemoryScape displays a visual report of the heap, Figure 27.
Figure 27: Heap Status Graphical Report |
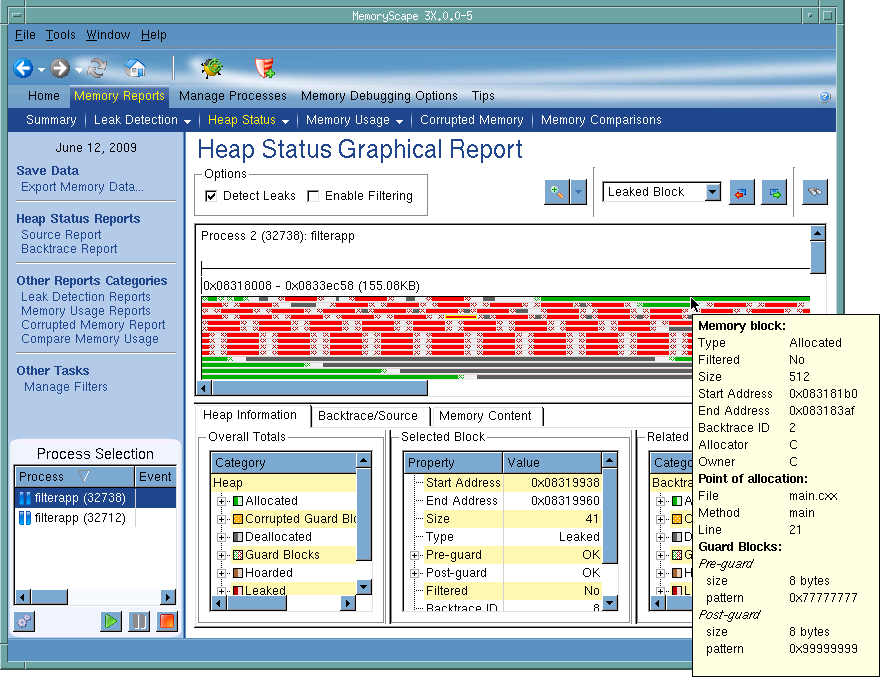 |
If you place the mouse cursor over a block, MemoryScape displays information about this block in a tooltip.
The display area has three parts. The small upper area contains controls that specify which content MemoryScape displays. The middle contains many bars, each of which represents one allocation. The bar’s color indicates if the memory block is allocated, deallocated, leaked, or in the hoard.
The bottom area has three divisions.
• The Overall Totals area summarizes the kinds of information displayed within the top area as well as providing a key to the colors used when drawing the blocks.
• If you select a block in the top area, the Selected Block area (obscured by the information pop-up) contains information about this block. When you select a block, MemoryScape highlights it within the top area.
• The Related Blocks area on the right displays how many other blocks your program allocated from the same location. (Actually, this just shows how many allocations had the same backtrace. If your program got to the same place in different ways, each different way would have a different backtrace, so MemoryScape doesn’t consider them related.)
Now that you have this information, you can begin making decisions. Obviously, you should fix the leaks. If there were a lot of small blocks, is your program allocating memory too frequently? Should it be allocating memory in larger blocks and managing the allocated memory directly? Is there a pattern of allocations and deallocations that prevents reuse?
NOTE >> Memory managers tend to be lazy. Unless they can easily reuse memory, they just get more. If you use the Memory Usage Page to monitor how your program is using memory, you’ll probably find that your program only gets bigger. Once your program grabs memory from the operating system, it doesn’t usually give it back. And, while it could reuse this memory if your program deallocates the block, it is easier and quicker just to grab new memory. |


