Setting Source-Level Breakpoints
Typically, you set and clear breakpoints before you start a process. To set a source-level breakpoint, select a line number in the Process Window.
Source Pane Line Number Indicators
A boxed line number in the Source Pane indicates that the line is associated with executable code:
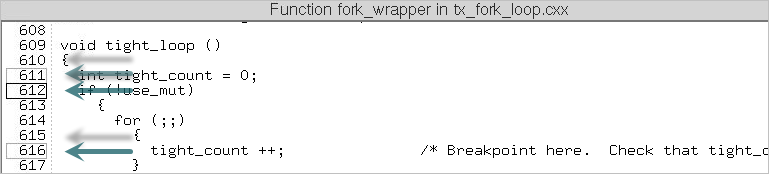
For example, Figure 92 illustrates that source lines 611 and 616 both have a single line number symbol, while line 612 has multiple line number symbols. Lines with no box indicate that no executable code exists at those source lines yet (although you can set a sliding or pending breakpoint at those lines, discussed in Pending Breakpoints and Sliding Breakpoints).
 |
To set a breakpoint in several ways, either:
You can also set a breakpoint while a process is running by selecting a boxed line number in the Source Pane.
A  icon in both the Source Pane and the Action Points tab reports that a breakpoint has been set immediately before the source statement.
icon in both the Source Pane and the Action Points tab reports that a breakpoint has been set immediately before the source statement.When you set a breakpoint or barrierpoint, it is defined by a breakpoint expression, also called a breakpoint specification, displayed in the Action Points tab for that breakpoint, or entered into the CLI (if created using the CLI). For more information, see dbreak in the TotalView Reference Guide.
Choosing Source Lines
If you’re using C++ templates, TotalView sets a breakpoint in all instantiations of that template. If this isn’t what you want, clear the button and then select the Addresses button in the Action Point Properties Dialog Box. You can now clear locations where the action point shouldn’t be set.
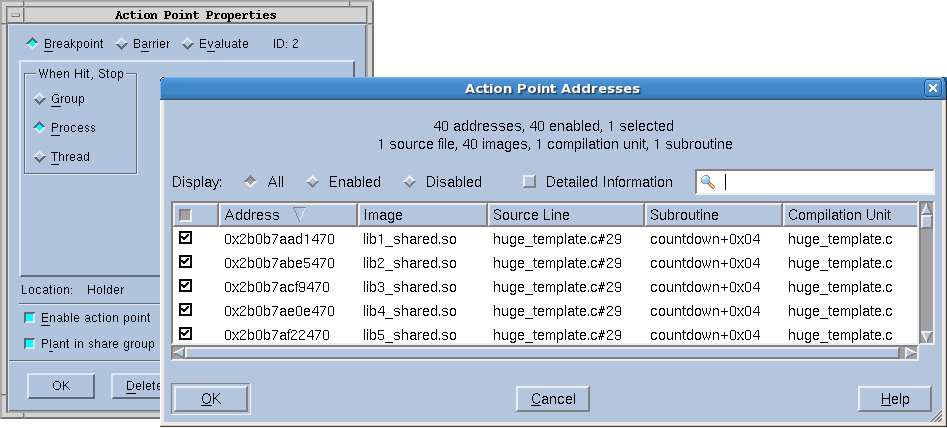 |
Initially, addresses are either enabled or disabled, but you can change their state by clicking the checkbox in the first column. The checkbox in the columns bar enables or disables all the addresses. This dialog supports selecting multiple separate items (Ctrl-Click) or a range of items (Shift-Click or click and drag). Once the desired subset is selected, right-click one of the selected items and choose Enable Selection or Disable Selection from the context menu.
Filtering
In complex programs that use many shared libraries, the number of addresses can become very large, so the Addresses dialog has several mechanisms to manage the data. The search box filters the currently displayed data based on one or more space-separated strings or phrases (enclosed in quotes). Remember that data not currently displayed is not included in the filtering. It may be helpful to click the Detailed Information checkbox, which displays much more complete symbol table information, giving you more possibilities for filtering.
Sorting
Clicking on the column labels performs a sort based on the data in that column. Each click toggles between ascending and descending order. If entry values in a column are the same, the values of the column to the right of the sorted column are examined and sorted based on those values. If the values are the same, the next column is examined and so on, until different values are found. The Addresses dialog uses a stable sort, i.e. if all the entries are the same in the selected column and in the columns to the right, the list is not modified.
Displaying and rearranging columns
Finally, right-clicking in the columns bar presents a context menu for displaying or hiding columns. All are initially displayed except Image. You can reorder the columns by selecting a column label and dragging it to a new location.
Keyboard Shortcuts
To provide easy access to the buttons at the bottom of the Addresses dialog, the following mnemonic keys have been assigned.
Button | Keyboard Sequence |
|---|---|
OK | Alt-o |
Cancel | Alt-c |
Help | Alt-h |
Similarly, in a multi-process program, you might not want to set the breakpoint in all processes. If this is the case, select the Process button.
 |
Sliding Breakpoints
If you try to set a breakpoint in the Source Pane at a location with no boxed line, i.e., if there are no line number symbols for that source code line yet, TotalView automatically “slides” the breakpoint to the next line number in the source file that does have a line number symbol.
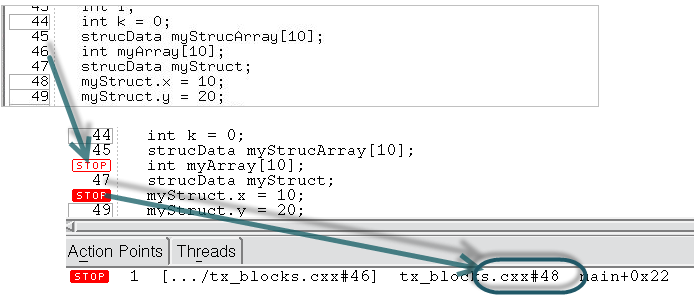
For example, in Figure 96, a breakpoint was set at line 46 and slid to line 48 where there was a line number symbol. The Source Pane then displays a hollow stop icon indicating that it slid, along with a stop icon at the slid location.
 |
NOTE: The Action Points tab always displays the full breakpoint expression (in brackets). It also displays the "best" source file and line number it can currently find. TotalView does not change the original breakpoint expression, in the event that dynamically loaded code would be a better match later.
The Action Points tab displays the full breakpoint expression in square brackets, abbreviating by-line breakpoints to save space in the display. Following the breakpoint expression, it also displays the "best" source file and line number it can currently find.
The breakpoint expression—pointing to line 46—is displayed in the Actions Points tab as well as the location of the actual breakpoint at line 48. Retaining the original expression supports the situation in which a library that is dynamically loaded does have line number symbols at that location. As the program runs and dynamically loads code, TotalView reevaluates the breakpoint expressions, factoring in any new line number symbols it finds. If better-matching line number information is found, the address blocks in the breakpoint are updated to add the addresses of the new line number symbols, and possibly disable or invalidate old address blocks. This ensures that the breakpoint triggers for the most relevant source line.
If TotalView cannot find a line number symbol following the line specified in the breakpoint expression, it creates a pending breakpoint. For example, this could occur when setting a breakpoint at the end of a source file. See Pending Breakpoints for information.
Dynamic Code Loading Example
To see how this works, consider a program that will load code at runtime, such as when debugging CUDA code running on a GPU.
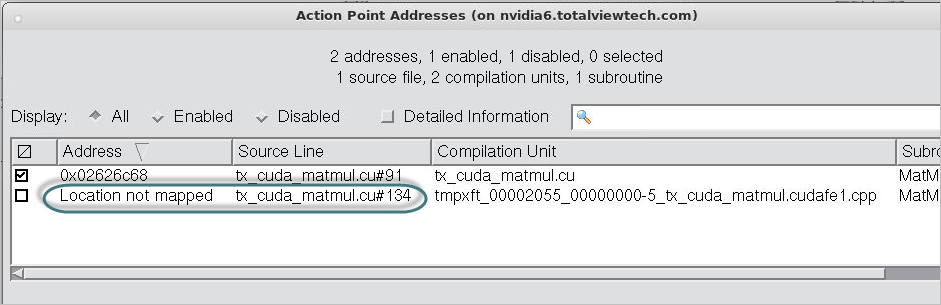
Figure 97 illustrates a breakpoint set at line 91 that has slid to line 134:
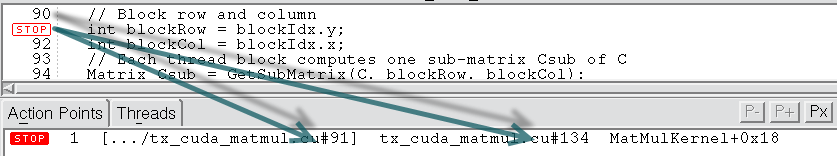 |
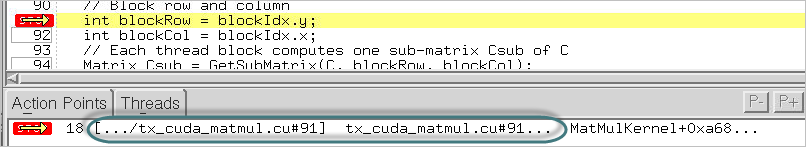
Once the program is running and the CUDA code is loaded, TotalView recalculates the breakpoint expression and is able to plant a breakpoint at line 91 in the CUDA code, which is an exact match for the breakpoint expression:
If you focus on the CUDA thread, then view the breakpoint address information (by selecting the breakpoint, right-clicking and selecting Properties, then clicking the Addresses button), the Action Point Addresses dialog reports that line 134 is not mapped to a breakpoint location, since it’s in the host thread; TotalView disabled the address block at line 134 in the host code because line 91 was a better match for the breakpoint expression: