Adding and Editing Filters
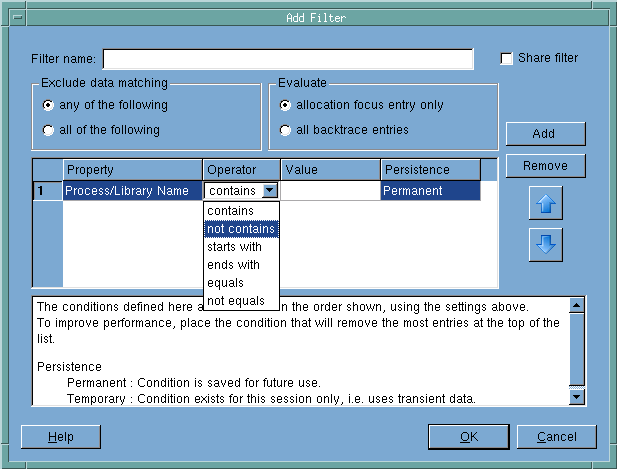
Selecting the Add button in the Memory Debugging Data Filters dialog (Figure 66), launches the Add Filter dialog, Figure 67.) Similarly, clicking the Edit button launches a nearly identical window.)
Figure 67: Add Filter Dialog Box 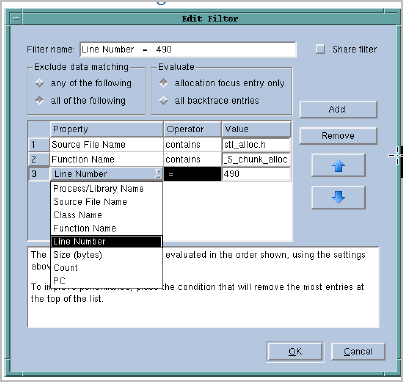 |
The controls in this window are:
Filter name
The name of the filter. This name will appear in the Memory Debugging Data Filters dialog box.
In Figure 67, notice that one filter is named “Function Name contains _S_chunk_alloc”. This is the name created by MemoryScape when you use the context menu to add a function name. Similarly, you’ll see a filter named “Line Number = 490”.
Share filter
Creates a shared filter. Shared means that anyone using MemoryScape can use the filter.
NOTE >> This button appears only if you have write permissions for the MemoryScape lib directory. |
Add
Adds a blank line beneath the last criterion in the list. You can now enter information defining another criterion for this filter in this new line.
Remove
Deletes the selected criterion. To select a criterion, select the number to the left of the definition.
Up and Down
Changes the order in which criteria appear in the list. Criteria are applied in the order in which they appear, so you should place criteria that remove the most entries at the top of the list. Filtering can be a time-consuming operation, so this can increase performance.
Exclude data matching
For more than one criterion, the selected radio button indicates if any or all of the criteria have to be met.
any of the following
Removes an entry when the entry matches any of the criteria in the list.
all of the following
Removes a memory entry only if it fulfills all of the criteria.
Evaluate
Limits which backtraces MemoryScape looks at.
allocation focus entry only
Removes an entry only if the criteria is valid on an entry that is also the allocation focus.
The allocation focus is the point in the backtrace where MemoryScape believes your code called malloc().
For example, if you define a filter condition that says Function Name contains my_malloc and set this entry to allocation focus entry only, MemoryScape removes entries only whose allocation focus contains my_malloc. That is, it removes only allocations that originated from my_malloc.
In contrast, if you set this entry to all backtrace entries, MemoryScape removes all blocks that contain my_malloc anywhere in their backtrace.
all backtrace entries
Applies filter criteria to all function names in the backtrace.
Criteria
A filter is made up of criteria. Each criterion specifies what to eliminate from the list. Each criterion has three parts: a property, an operator, and a value. For example, you can look for a Process/Library Name (the property) that contains (the operator) strdup (the value).
Property
When evaluating an entry, MemoryScape can look at one of eight properties for one criterion, Figure 68. Select one of the items from the pulldown list. These items are:
Backtrace ID | PC |
Class Name | Process/Library Name |
Count | Size (bytes) |
Function Name | Source File Name |
Line Number |
Operator
Indicates the relationship the value has to the property, Figure 68. Select one of the items from the pulldown list. If the property is a string, MemoryScape displays the following list:
contains | not contains |
ends with | starts with |
equals | not equals |
If the item is numeric, it displays the following list:
<= | >= |
< | > |
= | != |
Value
A string or a number that indicates what to compare.
Figure 68: Add Filter Dialog Box |
 |


