Examining and Editing Data
Diving and Viewing Data
Diving is integral to the TotalView GUI and provides a quick, intuitive, and effective way to get more information about various program elements. Diving is usually performed by just double-clicking on an element and generally launches a window with more information. You can dive on variables of course, but also on processes and threads, the call stack, functions, and source code.
To dive on a variable, just double-click on it or highlight it and select View > Dive to launch a Variable Window, Figure 14.
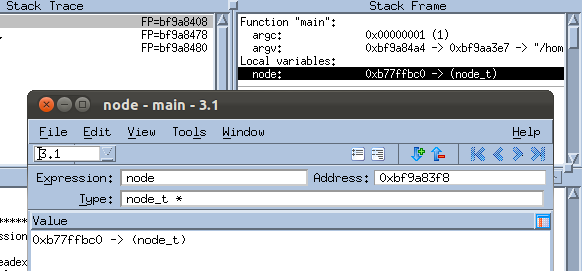 |
Local variables are visible in the Stack Frame as in Figure 14, while global variables are available in the Source Pane.
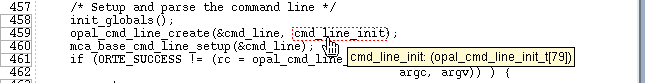
In the Source Pane, if a global variable or function can be dived on, a red dotted box appears when your cursor hovers over it, Figure 15.
 |
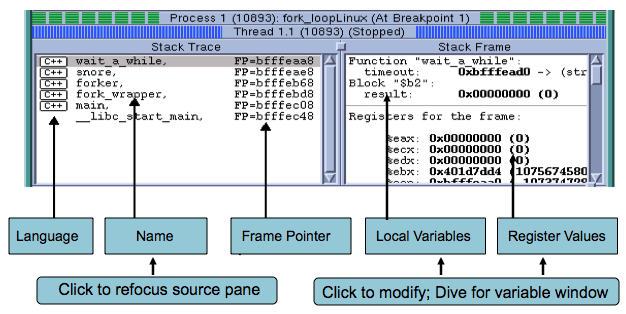
For example, the Stack Frame Pane in the Process Window contains the current call stack. When you dive on a routine, TotalView shows the routine in the Source Pane and its variables in the Stack Frame Pane.
 |
TotalView provides several other ways to see more detail about any aspect of your program:
Use Tools > Call Graph to launch a dynamic diagram that shows all the currently active routines. Click Update to recreate this display in a running program
Use Tools > Parallel Backtrace View to view the status of thousands of processes from a single window.
Use the Variable Window’s Tools > Visualize to view array data as a graph or in the Visualizer, a versatile, stand-alone program that can be launched directly from within TotalView or separately via the command line.
All objects you can dive on | |
Diving in a Variable Window | |
The View > Dive In All command | |
Displaying your call graph | |
Displaying STL variables | |
Displaying assembler code | |
Viewing processes and threads | |


