Root Window
Root Window Pages
The Root Window contains a list of all the processes and threads you are currently debugging. Diving into a process or thread by double-clicking or using the View > Dive command opens a window for the selected process. If a window already exists for that process, TotalView brings it to the front. Each process is shown with a short summary of its state.
Viewing Remote Processes
When debugging a remote process, the Root Window (and Process Window) display the host name on which the process is running. In Figure 1, the process is running only on localhost. This figure also describes the contents of the columns in this window.
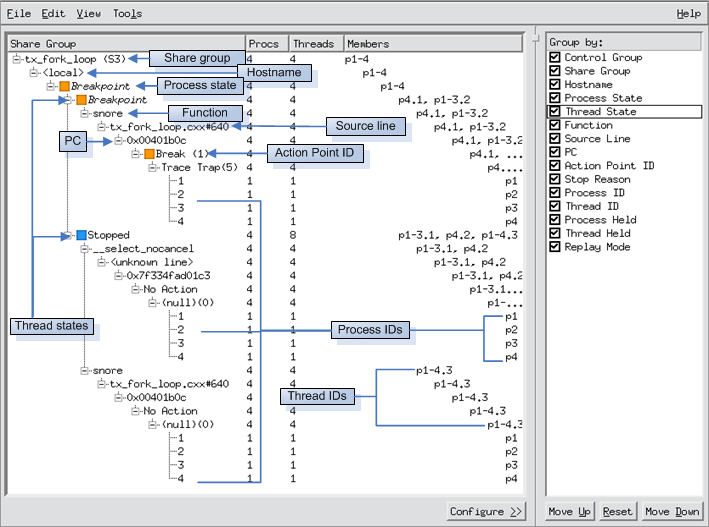 |
Figure 1 illustrates a two-process job. At the highest level, processes are grouped by the selections in the right Configure pane. The individual groupings are then sorted in ascending order ("Members") by the debugger's process ID.


