Tools > Add to Block Properties
The Memory Block Properties Window displays information about all of the blocks that you asked the Memory Debugger to keep track of by using this command. You can only use this command if this variable’s memory block was allocated within the heap. For example, assume that you have the following statements within your program:
void *s;
s = malloc(sizeof(int)*200);
You cannot obtain block properties for variable s as s is allocated on the stack. However, after malloc() allocates memory, s points to a memory block. You can now have the Memory Debugger watch this allocated block.
This means that you will need to dive on a pointer so that TotalView can dereference the pointer before you use this command.
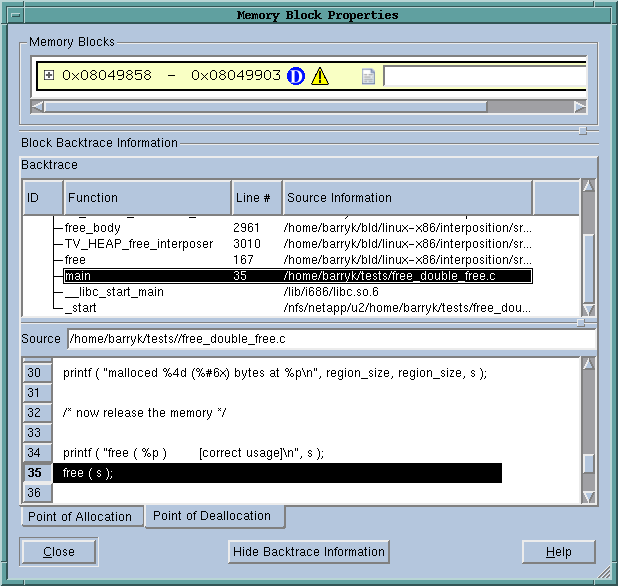
You can display this window in two different ways. Pressing the Hide Backtrace Information conceals most of what is displayed in Figure 102.
 |
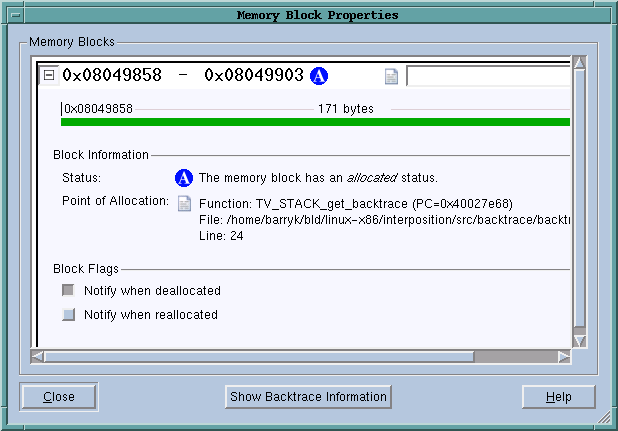
After pressing this button, the window reconfigures itself to that shown in Figure 103. When this window is being displayed, pressing Show Backtrace Information shifts it back.
 |
As an alternative, you can both make the window larger and use the splitter control to enlarge the top area.
The information within the bottom area is essentially the same as that which is displayed when you generate a Backtrace View in the Memory Debugger. For information on the Block Backtrace Information area, see "Heap Status Source Backtrace Report" in Debugging Memory Problems with MemoryScape.
The first line contains a graphical summary of the blocks information. It contains:
 in Figure 103 indicates that the block is allocated.
 icon, TotalView displays a tool tip that shows the function in which the block was allocated, the function’s source file, and the line number within that file.
The next lines within the Memory Blocks area restate the information that was presented in the summary area. The color of the block’s graphic is the same as that used in the Heap Status Page’s Graphical View.
The Block Flags area contains two check boxes:
Selecting a box tells the Memory Debugger that it should stop execution when the block is deallocated or reallocated and display the Memory Event Details Window. This allows you to track when your program is managing memory and what is being managed. For example, if you have a double free problem, obtaining notification lets you know where the block is first freed.


