Heap Status Source Report
Use this report to organize heap memory information by the place in your program at which the program allocated a memory block.
For more information, see “Task 8: Obtaining Detailed Heap Information.”
Move your cursor over the graphic to obtain help.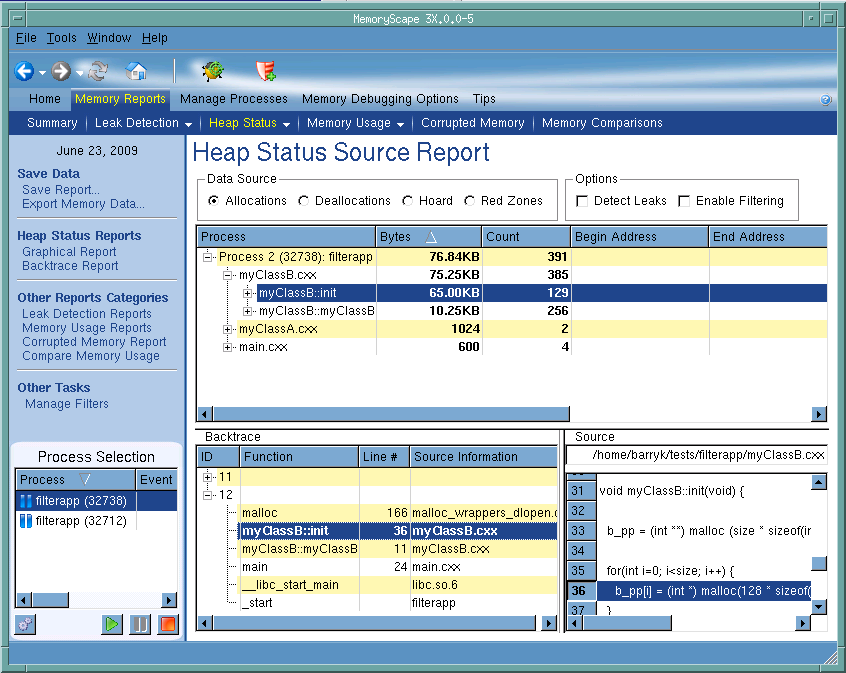
Process Selection
Contains a list of processes and files added to this memory debugging session.
Execution controls
These controls let you refresh or create ( ) this report, run (
 ), or halt (
 ) your program.
), or halt () your program.Data Source
Click on a radio button to tell MemoryScape what kind of information it should report. Your choices are Allocations, Deallocations, the Hoard, and Red Zones. You can only select one data source at a time. If you need to refer from one to another, you may want to use the Save View command (it’s on the left side of the screen) to write an HTML version of the view to disk.
Options
Click a check box to tell MemoryScape if it should show leaked memory within the graph and if it should apply your filter to this display.
After selecting Detect Leaks, MemoryScape analyzes memory and your program. This analysis looks for memory blocks that your program’s variables do not reference. It then displays unreferenced blocks in red within the graph.
After selecting Enable Filtering, MemoryScape applies your filter against the heap and removes any blocks that match the filter from the display.
Source area
Contains a hierarchical organization of the routines contained within your program. The root of the hierarchy is your process. Beneath it are the files that contain your program. The next level are the routines contained within files. At the lowest level is the line number within the file.
Backtrace area
Contains the backtrace associated with a block that you select in the central corrupted block table. A backtrace is the call stack that existed when your program allocated the memory block.
Source code area
Shows the line in your program associated with the information shown in the backtrace area. When you click on a function in the backtrace area, the information in this area changes.
Debug in TotalView
Tells MemoryScape to open the currently selected process in TotalView. The TotalView process window will display the current state of that process. You must have a TotalView license available to debug in TotalView.
Be aware that opening the TotalView process window from within MemoryScape does not initialize TotalView in the same way as starting TotalView directly. The definitions in your .tvdrc file and your saved breakpoints are not loaded. However, you can load a breakpoint file using the Action Point menu item in the process window. If you need the definitions in your .tvdrc file, start TotalView first and open MemoryScape from within TotalView.
Red Zones
Tells MemoryScape to set the Red Zones option on or off for the selected processes.


